Analyzing Gunshot Detection Data in DC
Washington, D.C. uses a system called SpotShotter, which involves acoustic sensors that can detect the presence and location of gunshots. The devices, which I believe are usually attached to utility poles, also transmit alerts to law enforcement, who can then respond to the incident. The city also makes the data publicly available on a quarterly basis via Open Data DC.
This is an incredibly sad topic, as the data here is mostly generated by real acts of violence throughout the city. I decided to explore this data out of concern for what seems like an increase in gun violence in the city over the past few years.
Sadly, there are have been several thousand incidents logged by the SpotShotter system since 2014, which is the earliest date that public data is available. This post will be a quick exploration of the publicly-available data covering January 2014 through September 2019.
Background on the Data
The data dictionary provided by the Metropolitan Police Department (MPD) suggests that all recorded SpotShotter incidents are released to the public via these reports. The District has been using SpotShotter since 2006, but has added additional sensors over the years: 300 according to Washington Post in 2013.
Geolocation
One of the more interesting features of SpotShotter is its ability to analyze the sound waves to pinpoint the origin of a gunshot with accuracy within 100 meters of its source. To visualize this, I am using the ggmap package, which combines the Google Maps API with the ggplot2 data visualization package. Recently, Google started requiring users of this API to register via the Google Cloud Platform (GCP). There is a nice walkthrough of this process on the Little Miss Data blog.
Overview of the Data
There were 37,592 incidents reported by SpotShotter between 2014-01-01 05:00:02 and 2019-09-30 23:57:43.
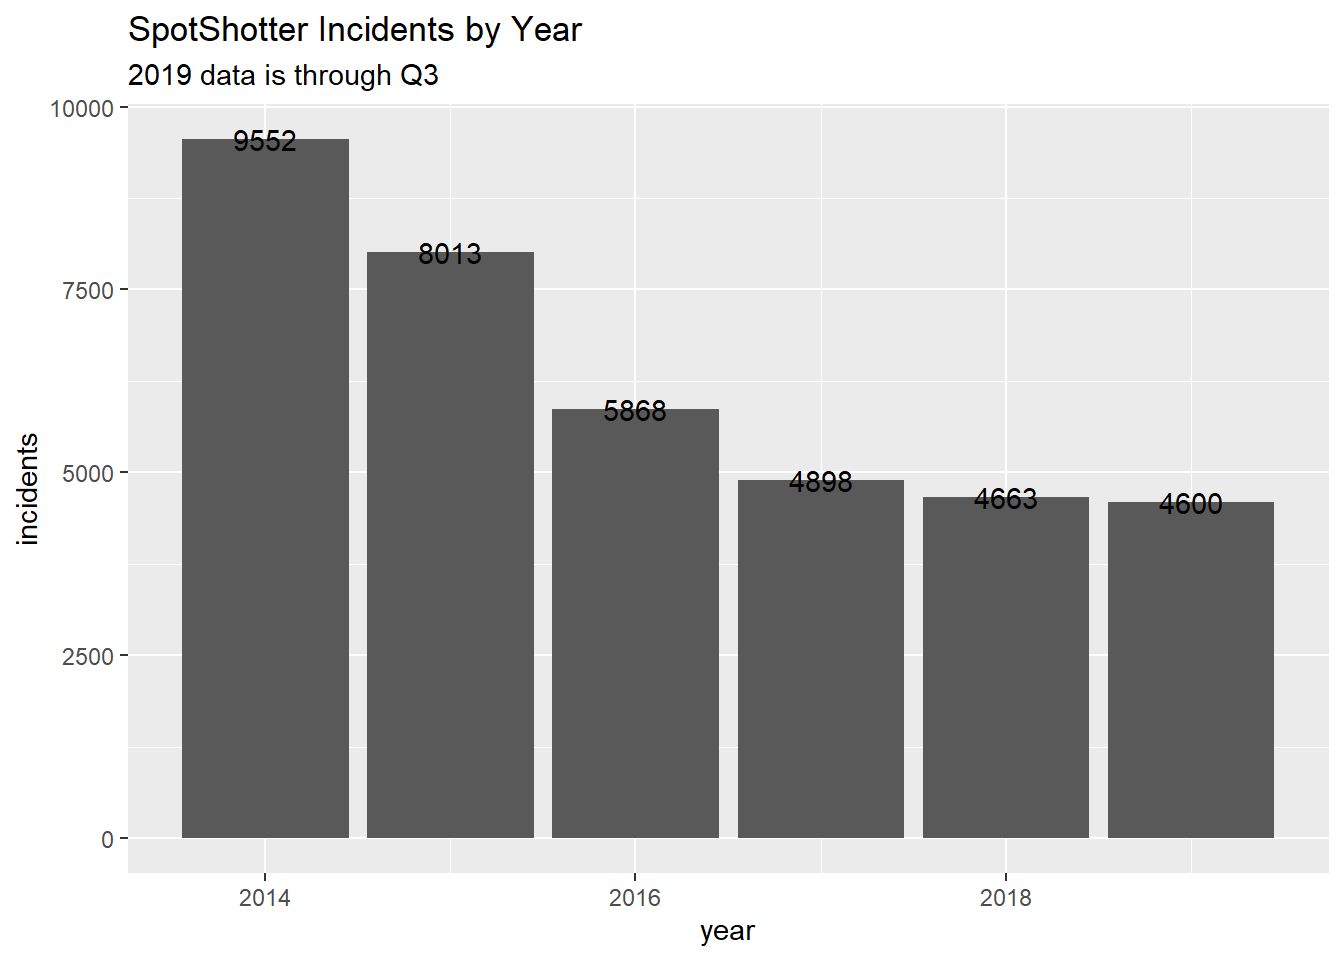
It seems that there has been a decline in incidents since 2014. The 2019 total will likely surpass the 2017 and 2018 totals, as it is only including incidents recorded through September 30, 2019. Also, the documentation suggests that the SpotShotter software has improved over the years to more accurately distinguish fireworks from gunshots.
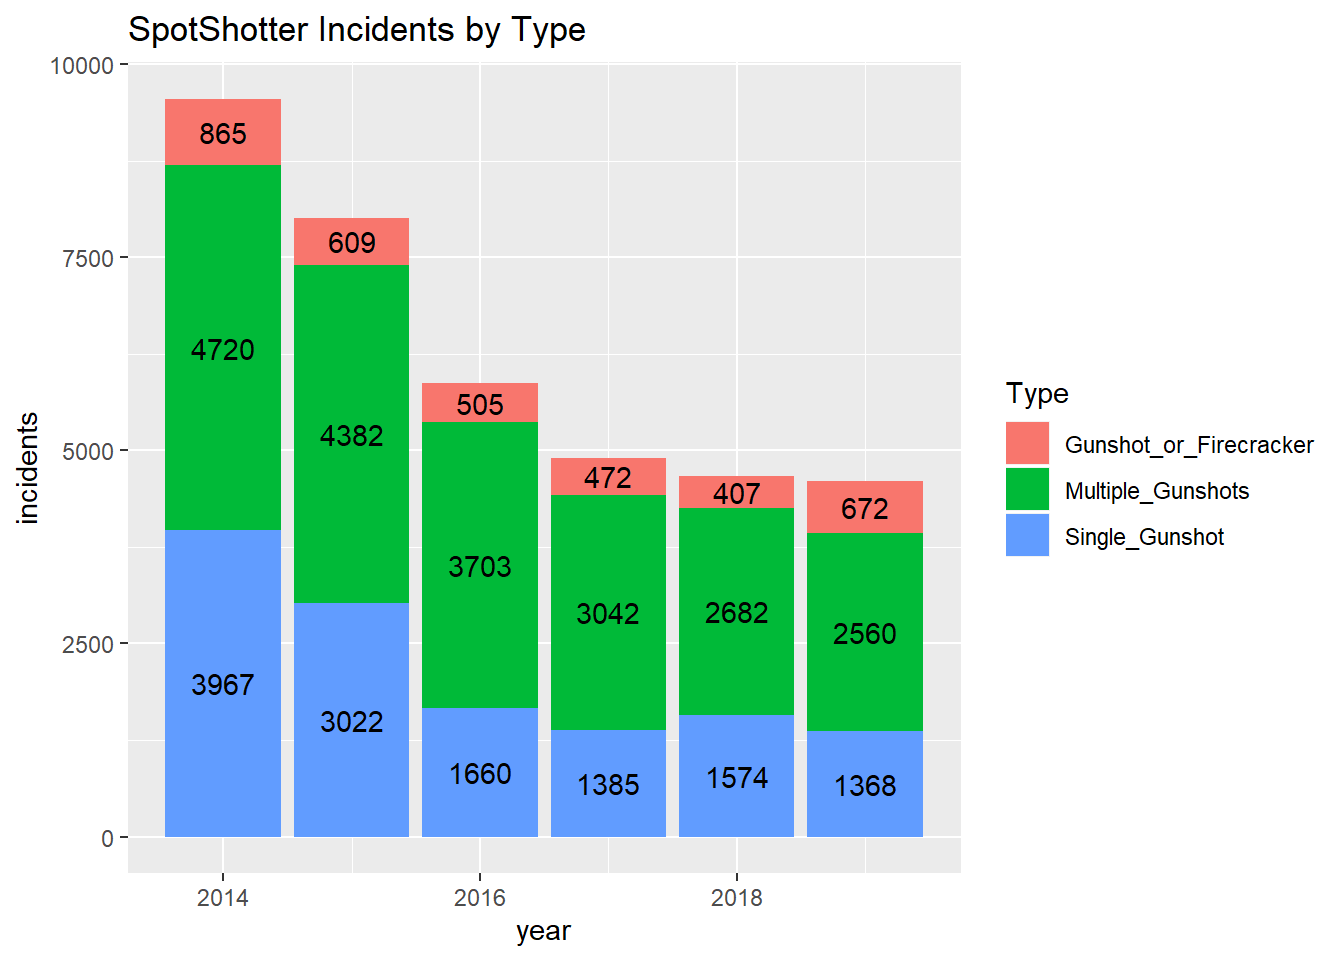
It’s curious to see the Gunshot or Firecracker classification increase so significantly in 2019.
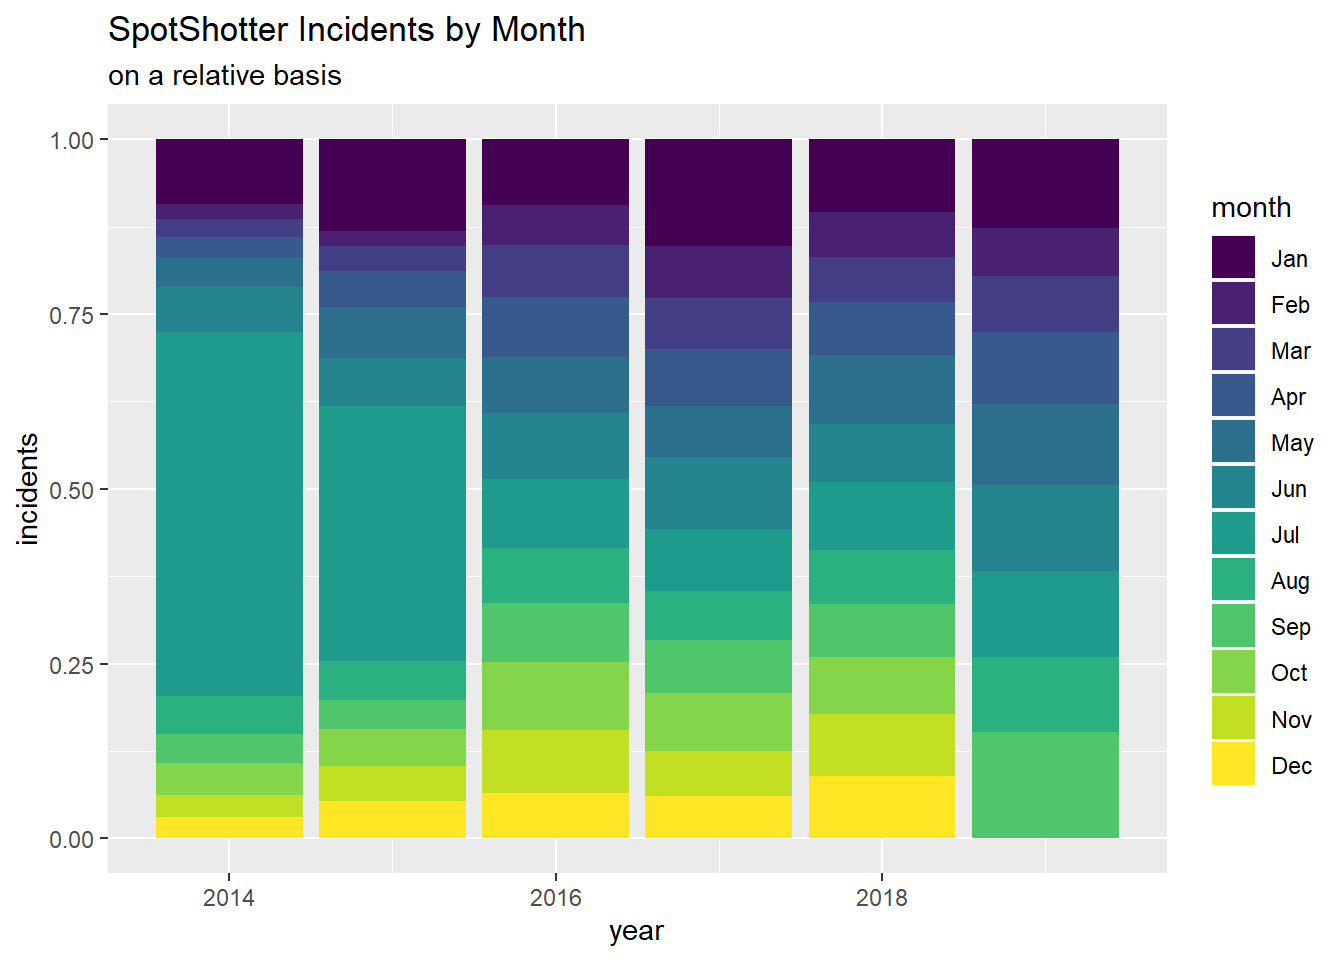
July of 2014 and 2015 recorded an extremely high number of incidents. This is due to Independence Day fireworks, typically recorded after midnight (i.e., July 5). The July days with the most incidents in 2014-15 are displayed below.
| day | incidents |
|---|---|
| 2014-07-05 | 3906 |
| 2015-07-05 | 1548 |
| 2015-07-04 | 491 |
| 2014-07-06 | 292 |
| 2014-07-04 | 166 |
| 2014-07-03 | 120 |
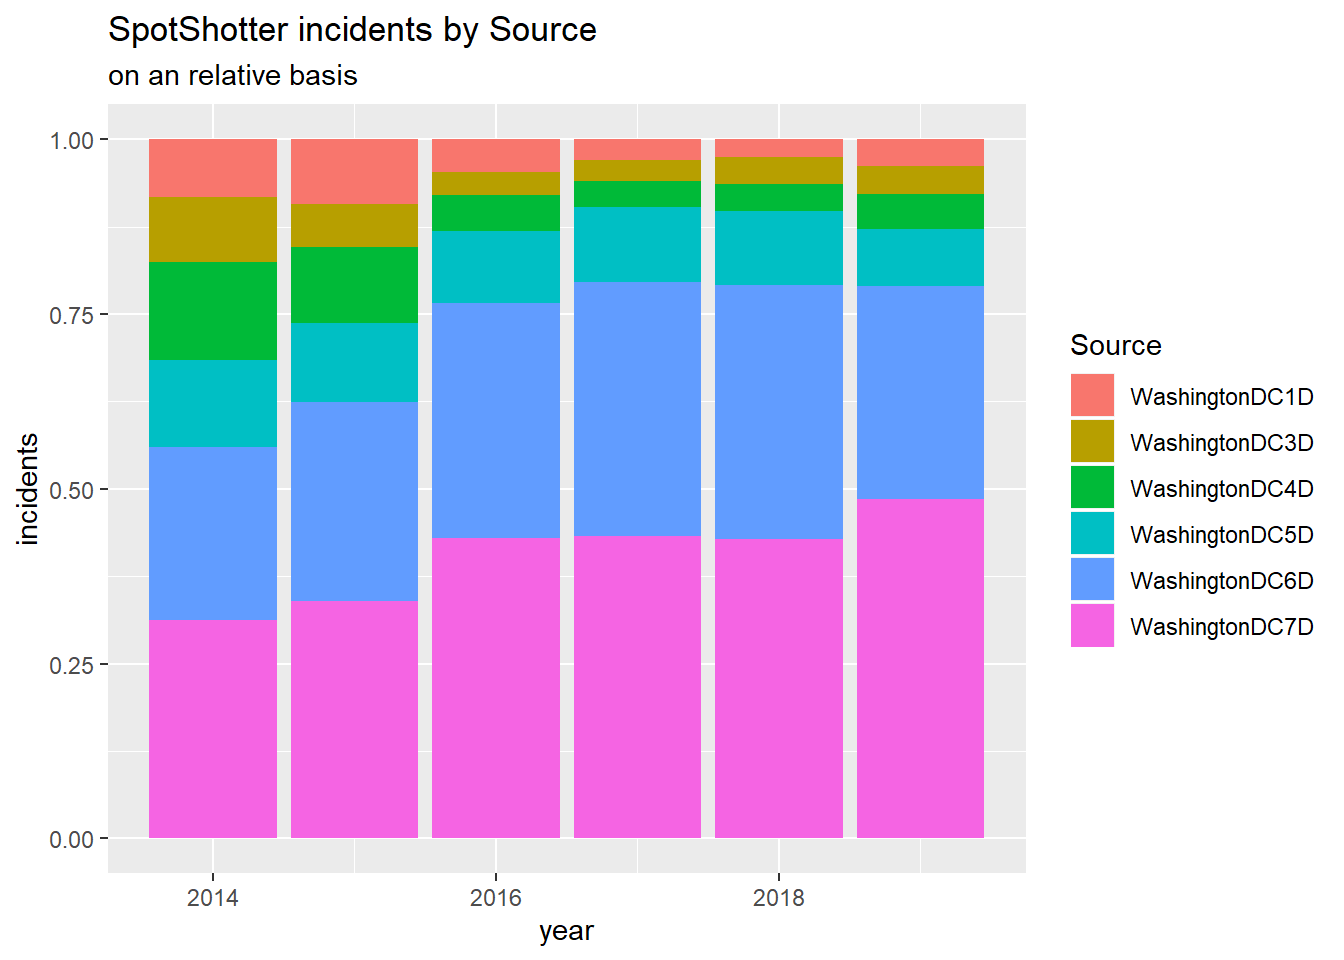
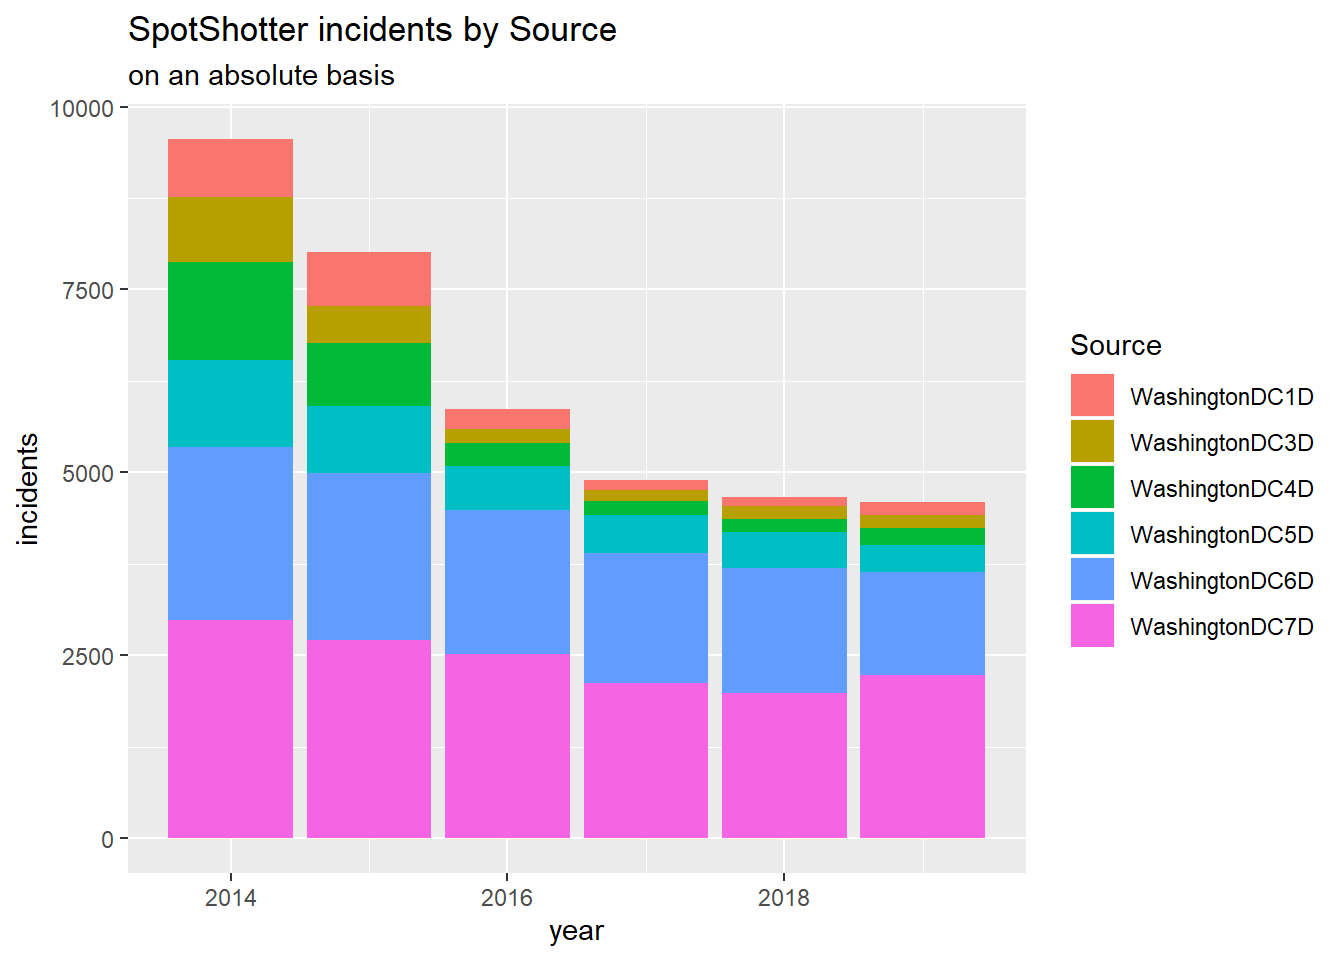
In addition to the longitude/latitude coordinates, the data also includes a Source field, which corresponds with the MPD District that the incident took place in. The majority of incidents were recorded in Districts 6 and 7, which more-or-less overlap with Wards 7 and 8. District 3 had the fewest incidents recorded over the full period. The 2nd District doesn’t appear at all in the data. It’s unclear how many SpotShotter sensors are installed in each of the policing boundaries. The table below describes the total number of incidents sourced by each police district, and the graphs below that shows the share of reports by Source by year, on a relative and absolute basis.
| Source | Incidents |
|---|---|
| WashingtonDC7D | 14564 |
| WashingtonDC6D | 11508 |
| WashingtonDC5D | 4076 |
| WashingtonDC4D | 3111 |
| WashingtonDC1D | 2252 |
| WashingtonDC3D | 2084 |
Visualizing on the DC Map
This is my first time working with ggmap, and I’m relying heavily on the examples shared in the blogpost reference earlier.
This is a density map showing the relative frequency of indicents in various throughout the city.
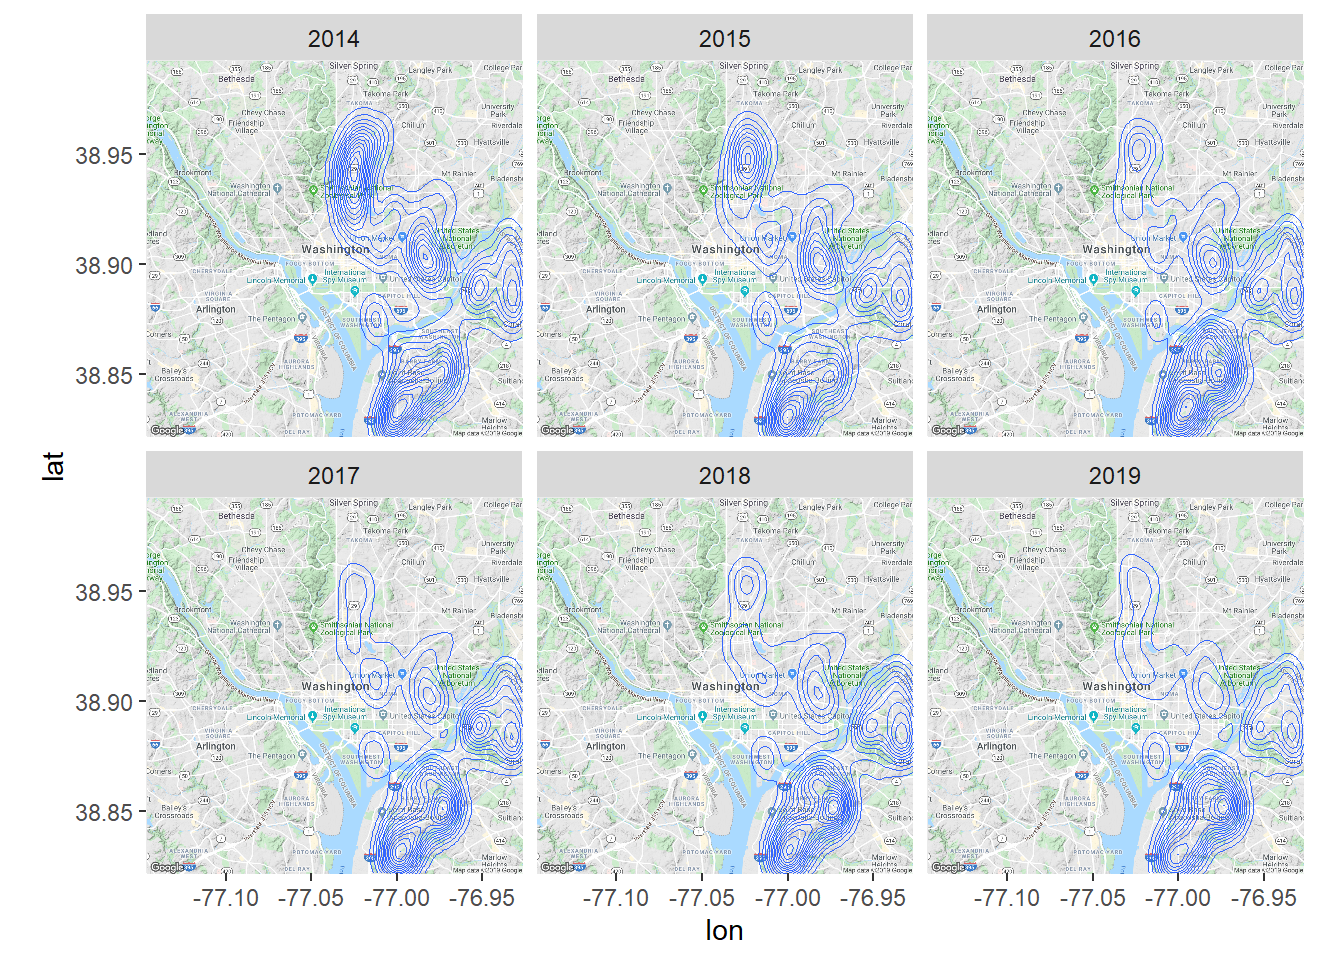
This closely mirrors the summary of incidents by Source (i.e., MPD Districts), where there is a high concentration of incidents east of the Anacostia River. It’s still unclear how concentrated the sensors are, so this should be taken with a grain of salt.
Next, I want to zoom in on the region near where I live, which is within the Third District. This can be done with the same code, but by using the Maps API to center the base map on a particular neighborhood, instead of having the Maps API center the map on Washington, DC in general.
For example:
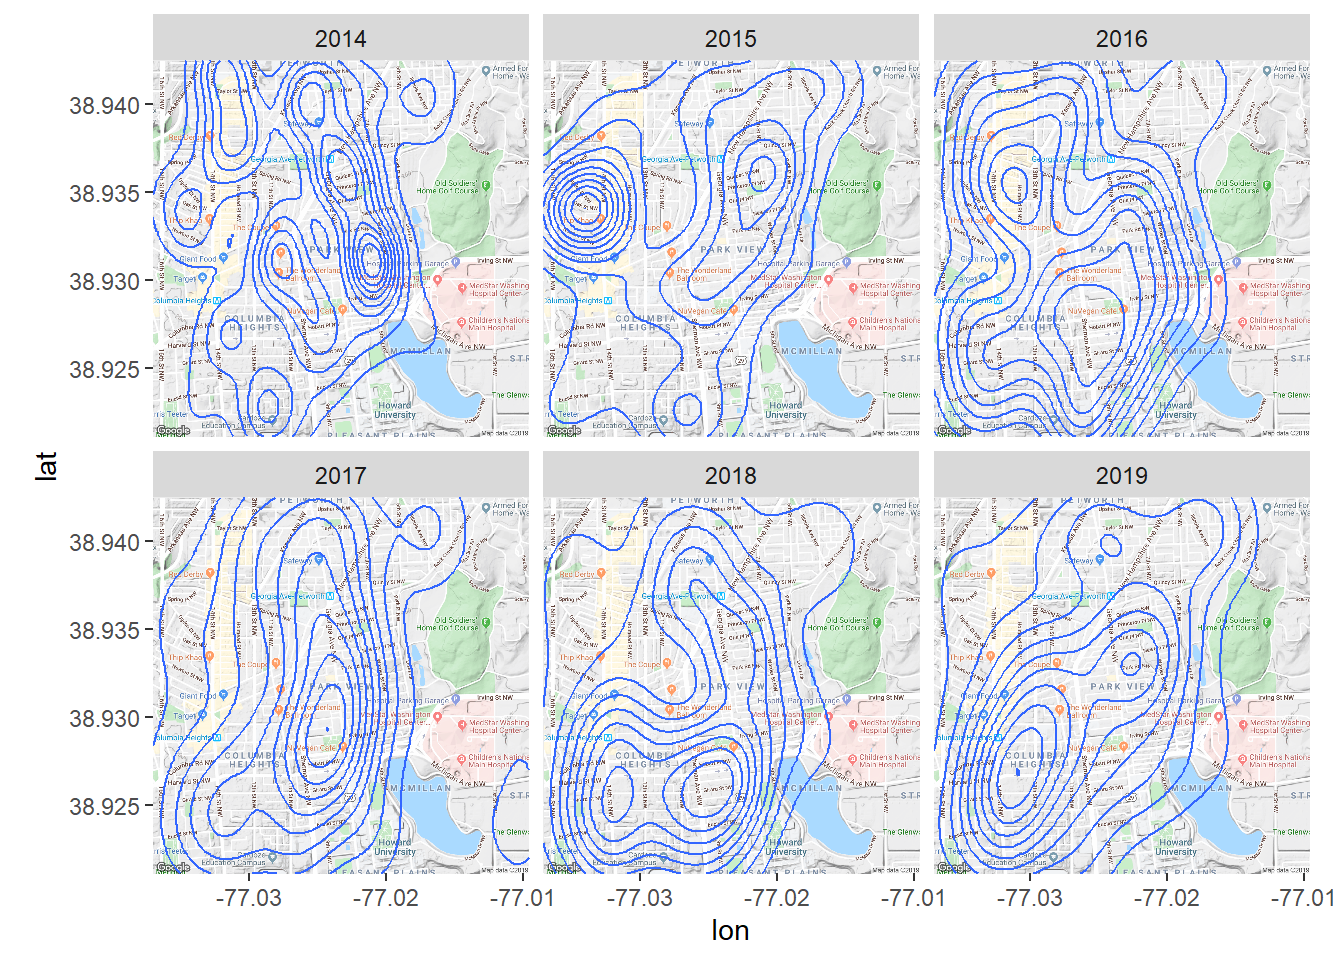
Unlike the city-level density, the neighborhood-level density seems to show fairly dramatic changes in locations from year to year.
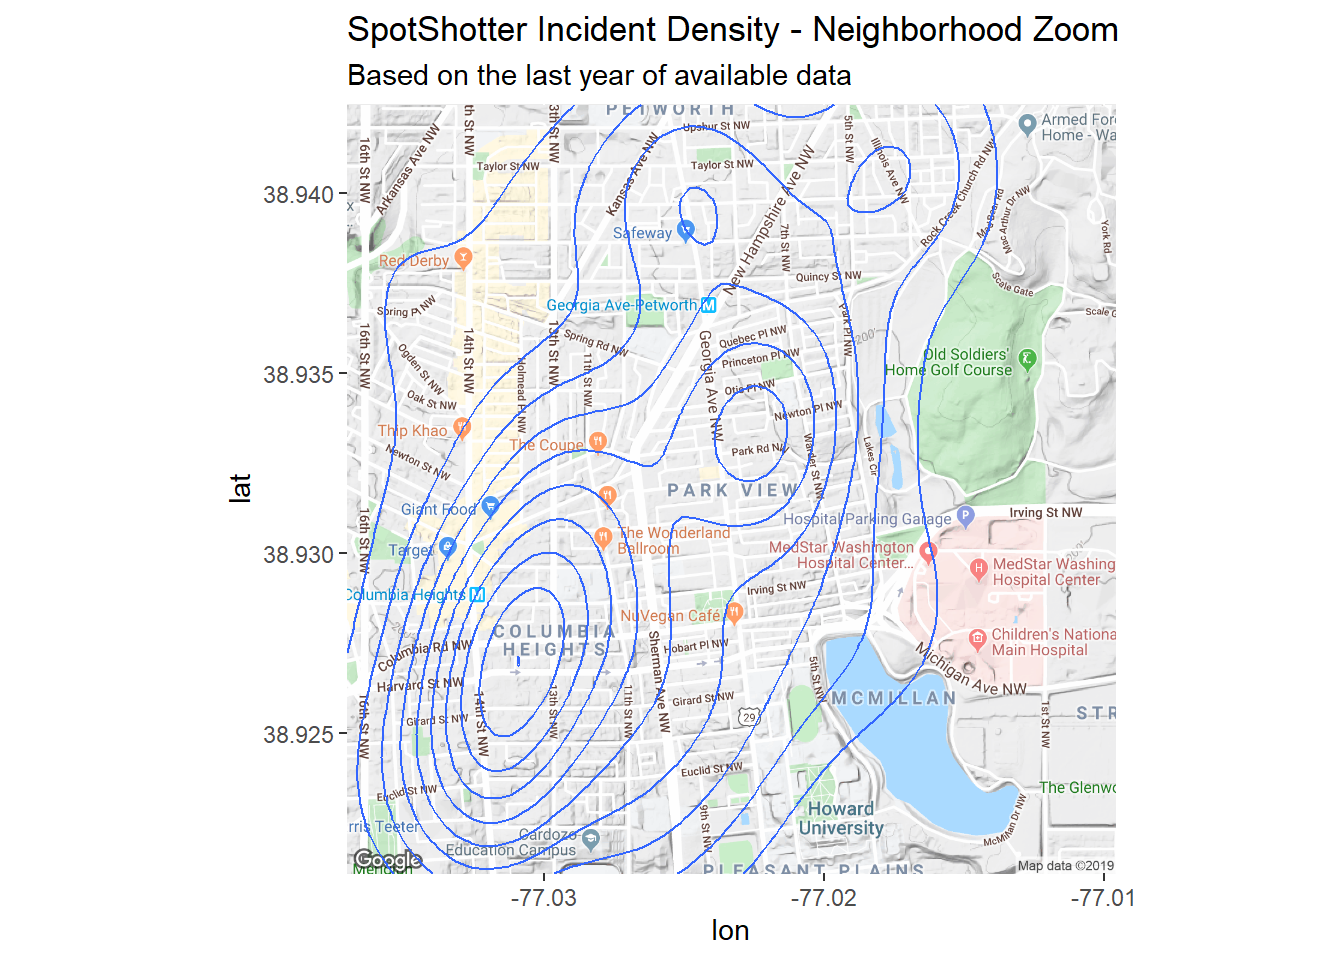
It’s somewhat difficult to tell where exactly the high frequency areas are at the current zoom level. This final map looks at the past year of available data, which hopefully improves the readibility.
Lastly, a quick plot on the number of incidents recorded by day of week and time of day.
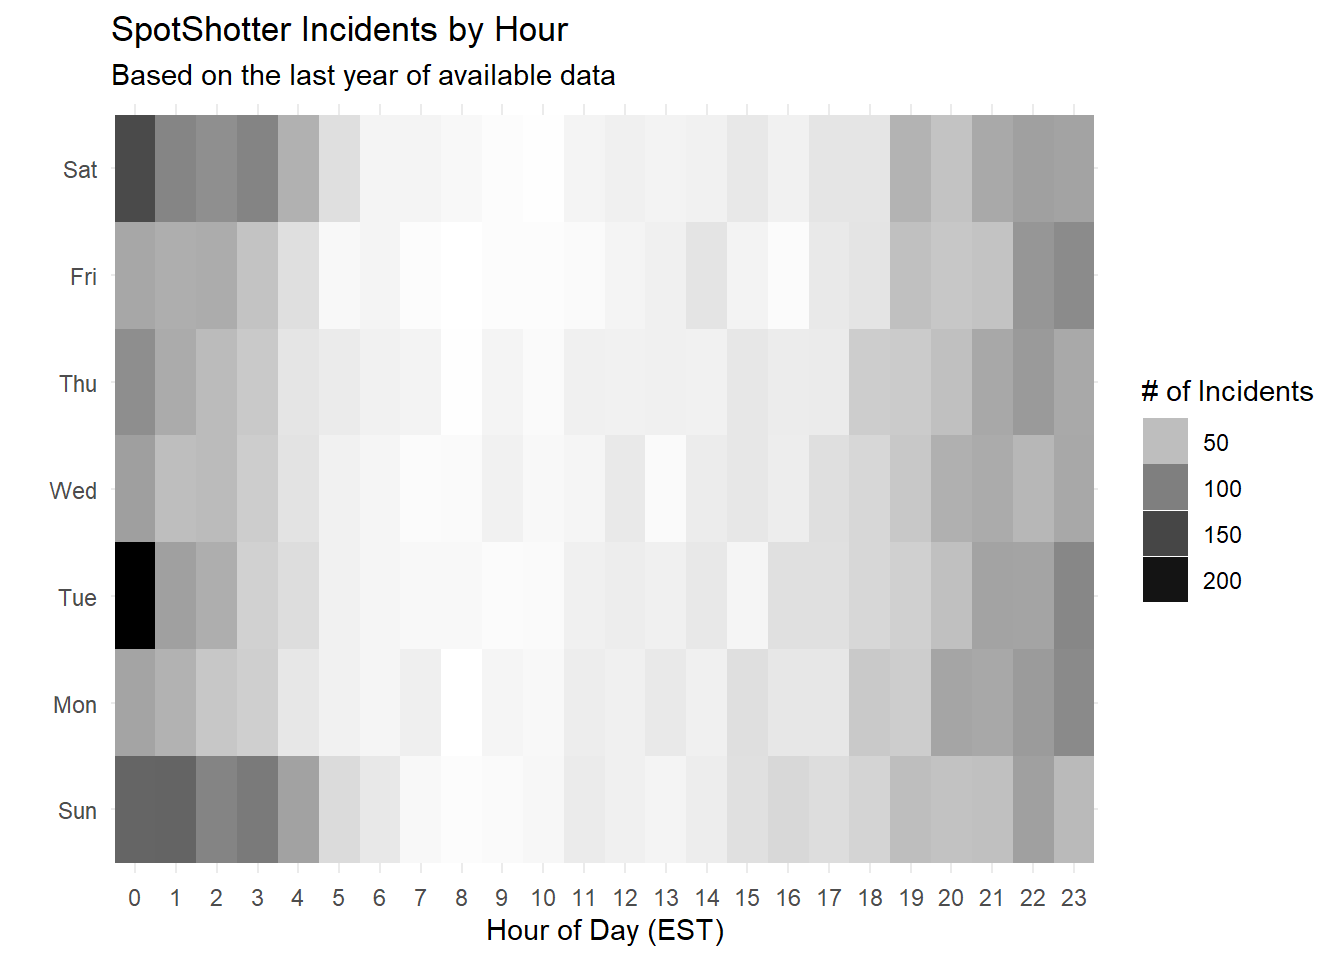
It seems like the majority of incidents take place during the overnight hours on weekends. There appears to have been quite a few incidents recorded on Tuesdays between midnight at 1AM. I may dig into this at a later time.
In the future, I would look at stripping out the July 4th incidents, which may be skewing some of the trends.
It has been a terrible year for gun violence in the District, with seemingly daily reports in the news. Hoping for a much more peaceful 2020.