Product Analytics on My Own Spotify Usage
Spotify does an incredible job of personalizing the user experience, using machine learning to curate daily playlists based on past listening habits, and surfacing new music recommendations via the Your Discover Weekly.
Spotify’s CEO recently noted on an earnings call that their secret sauce is online experimentation – running tests on its ~300M users, and using the learnings to improve its products. Two of the ways that Spotify evaluates the effectiveness of their experiments are (1) measuring increased engagement (streaming for longer periods of time), and (2) increased user retention (users returning to use Spotify’s products in the future).
The Data
I’ve requested my personal data from Spotify a couple of times, most recently a couple of days ago. Spotify has processed each request in a just a couple of days, and delivered the data via a zipped folder of JSON files. Documentation from Spotify.
One of the most interesting datasets is called StreamingHistory, which includes four fields:
- endTime: the date and time that an individually piece of streamed media ended
- artistName: the name of the artist or “creator” of the streamed media
- trackName: the name of the streamed media (i.e., a song name or podcast episode)
- msPlayed: the number of mili-seconds streamed
It’s clear that Spotify can articulate my personal taste in music and podcasts (in the form of recommendations) almost as well as I can. I’m curious to see what I can eventually learn about my listening behavior by applying retention and engagement frameworks, similar to the ones that Spotify uses to measure its own success, against my own listening data. For starters, I’ll do a high-level exploration of this dataset by running through a general survey of some of the popular analytic patterns in product analytics.
Previewing the Data
Randomly sampling 10 rows of StreamingHistory
| endTime | artistName | trackName | msPlayed |
|---|---|---|---|
| 2020-04-25 04:45:00 | Spencer Brown | Love & Pain | 43083 |
| 2019-01-14 00:33:00 | The Head and the Heart | Down in the Valley | 303653 |
| 2020-04-04 01:10:00 | Matt Fax | Set Your Sails (ABGT374) | 298064 |
| 2019-12-02 20:26:00 | deadmau5 | Monophobia | 214670 |
| 2019-04-20 18:34:00 | Willie Nelson | Come On Back Jesus | 127621 |
| 2019-05-29 19:28:00 | The Daily | What Actually Happened to New York’s Taxi Drivers | 1736956 |
| 2019-01-25 00:46:00 | Dennis Sheperd | Memoria | 230769 |
| 2019-04-17 00:35:00 | Kygo | Think About You - Galantis Remix | 3634 |
| 2020-01-02 01:54:00 | Louis The Child | Save Me From Myself (with NoMBe & Big Gigantic) | 211685 |
| 2018-11-07 20:12:00 | Andrew Bayer | Immortal Lover - In My Next Life Mix - Edit | 221719 |
Examining the timeframe
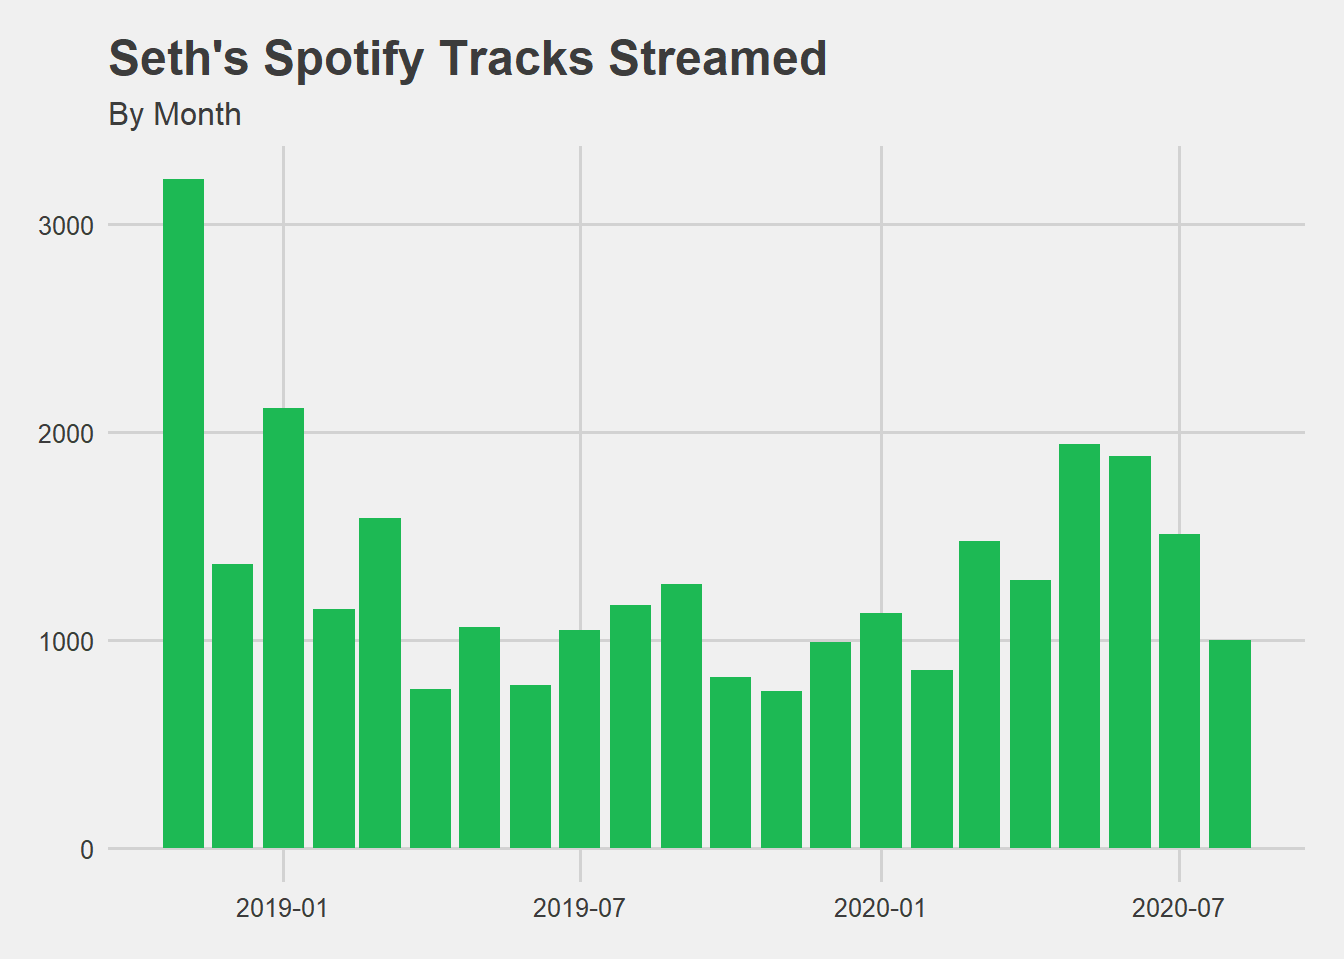
The dataset includes almost two years of continuous data, from 2018-11-01 through 2020-08-23.
To put the msPlayed data into an easier frame of reference, I’m adding fields that convert the data into minutes and hours: mins_streamed and hours_streamed.
Top 10 Artists by Streams, with hours played
| artistName | streams | % of streams | total_hours | % of hours |
|---|---|---|---|---|
| Above & Beyond | 1203 | 4% | 62.4 | 3% |
| Lane 8 | 845 | 3% | 62.6 | 3% |
| Andrew Bayer | 813 | 3% | 60.2 | 3% |
| Shakey Graves | 747 | 3% | 40.3 | 2% |
| Ilan Bluestone | 399 | 1% | 24.6 | 1% |
| RÜFÜS DU SOL | 373 | 1% | 23.3 | 1% |
| Luttrell | 336 | 1% | 24.4 | 1% |
| Gabriel & Dresden | 333 | 1% | 21.9 | 1% |
| Spencer Brown | 333 | 1% | 26.0 | 1% |
| Rayland Baxter | 324 | 1% | 17.2 | 1% |
Out of the 3,022 distinct artists I’ve streamed over the last ~2 years, this top 10 accounts for 19% and 17% of all tracks streamed and hours streamed, respectively.
Engagement Framework
I’m curious to know how my engagement with Spotify has trended over time, particularly within artists that I may have discovered recently.
Cumulative Engagement Over Time:
Plotting accumulating engagement over time, in terms of hours streamed, and days with at least one stream.
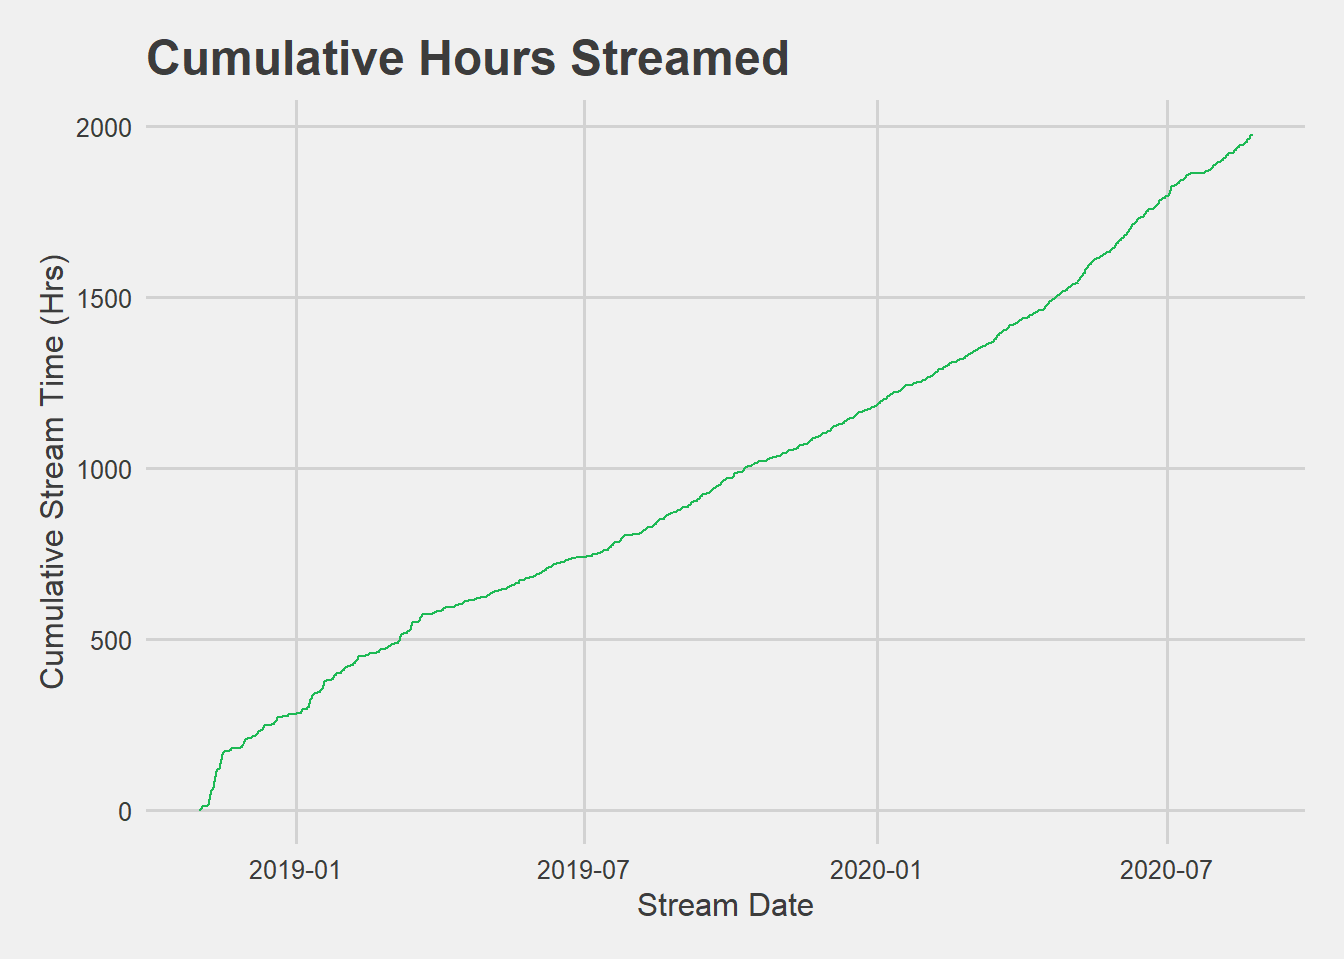
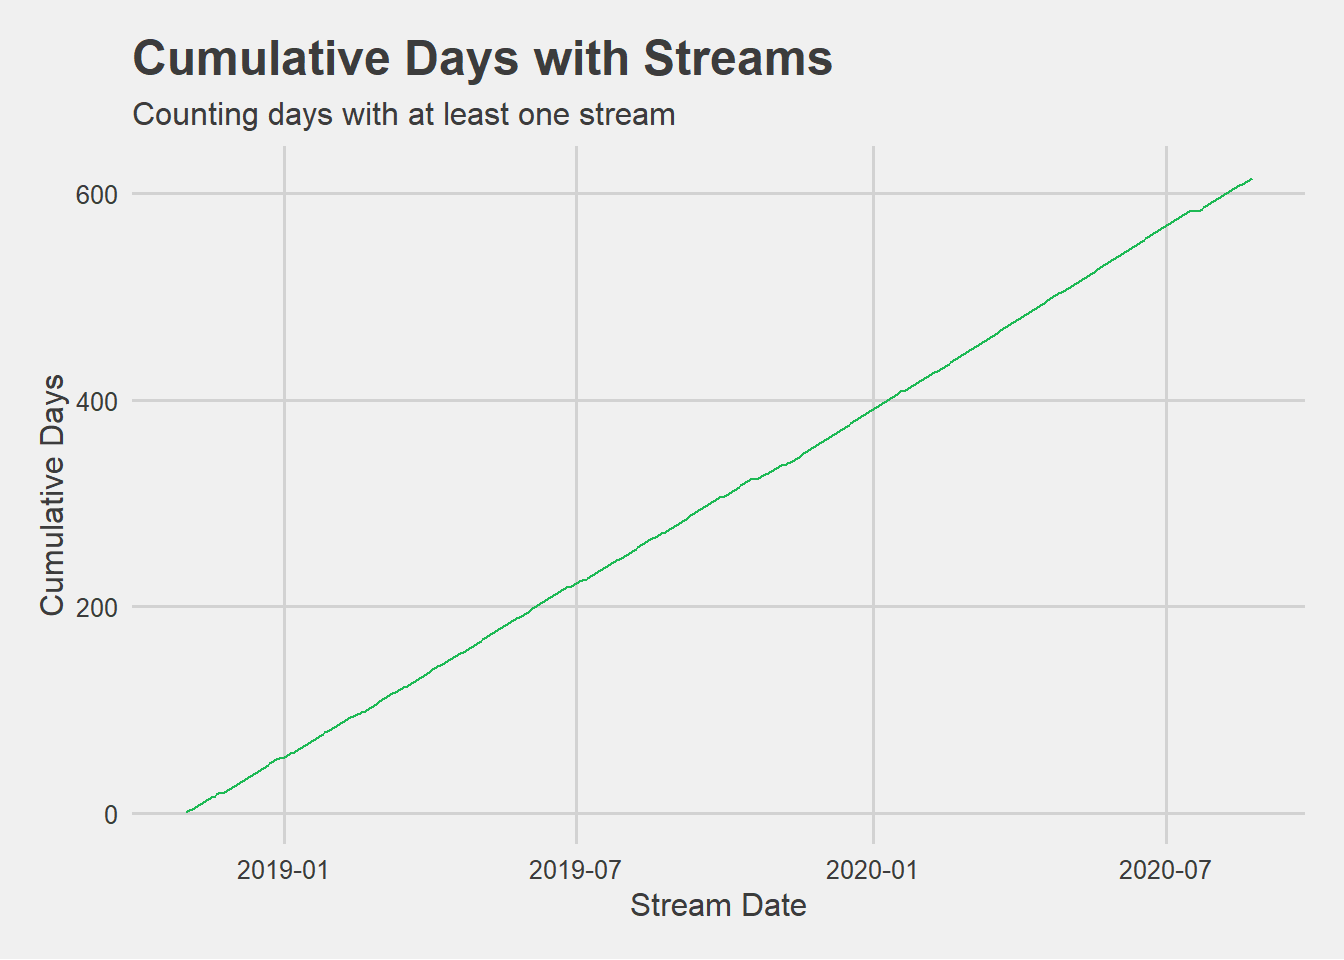
I’m not surprised to see that I use Spotify nearly daily. However, I think these plots potentially mask significant changes in my listening habits over the 2-year span, particulary amidst the transition from commuting to the office to working from home during the COVID-19 pandemic.
Cohort Analysis
Typical cohort analyses involve bucketing a group of users by a common trait, such as the month that they signed up for the product. Since I am the only user in the dataset, that wouldn’t be very interesting. Instead, I’m interested in analyzing cohorts of artists by the period that I first started listening to them.
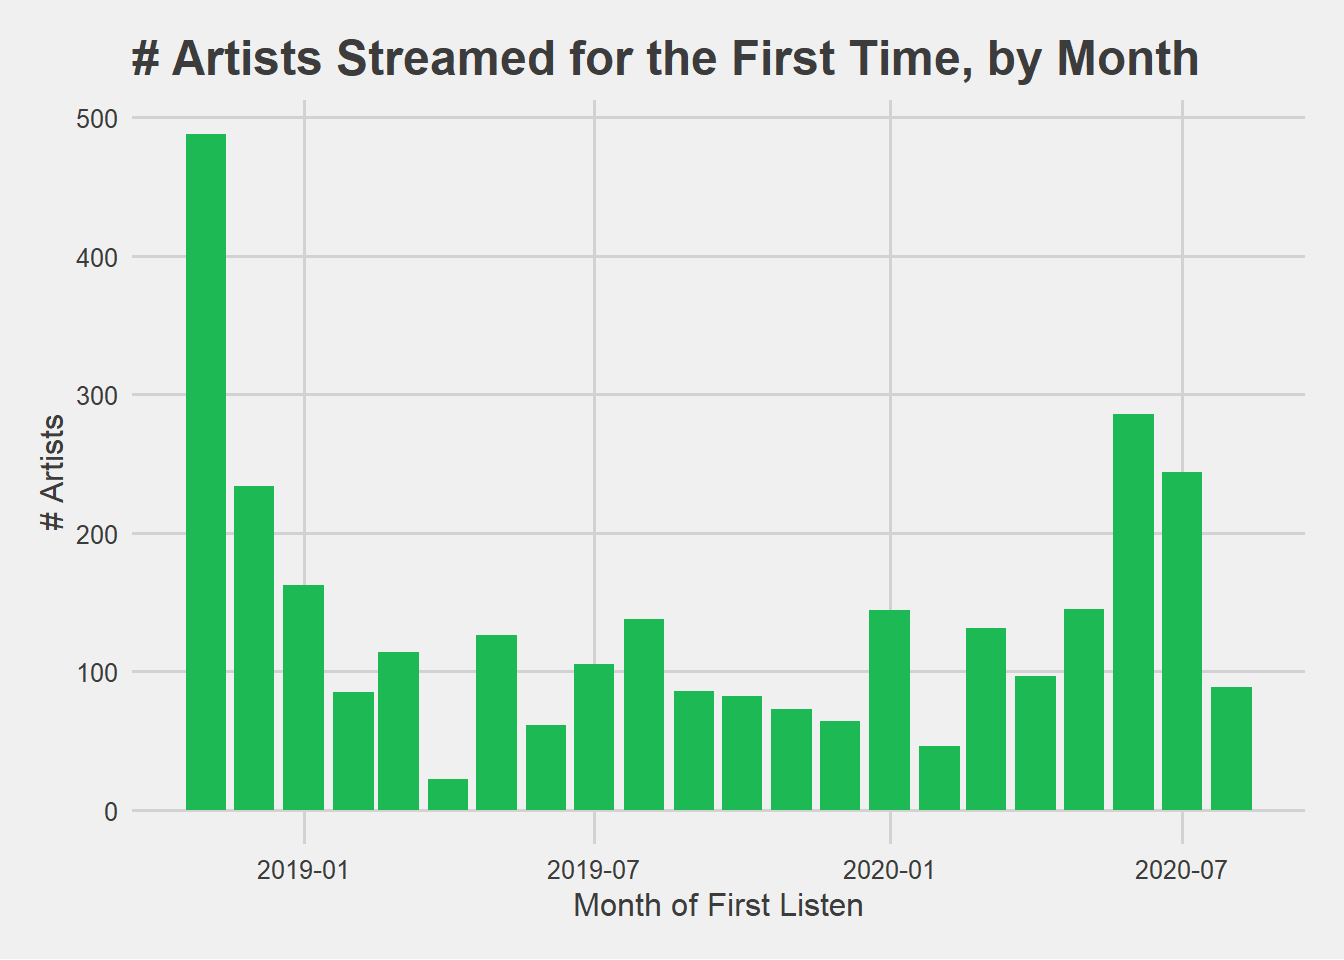
It’s useful to visualize the relative sizes of each cohort, to put the analysis into perspective. Since the data provided by Spotify only goes back as far as November 2018, it’s not entirely surprising that November 2018 is the largest cohort. In other words, artists that I had listened to prior to November 2018 will first appear in the first month that data is available, which would cause some bias in the November and December cohorts. For the sake of this analysis, and to understand how I discover new artists on Spotify, I’ll zoom in on the period between January 1, 2020 and August 23, 2020.
Engagement Cohorts
Using cohorts can uncover engagement insights that are difficult to understand in aggregate. This graph shows how my engagement with newly discovered artists has changed, based on the month that I first listened to those artists.
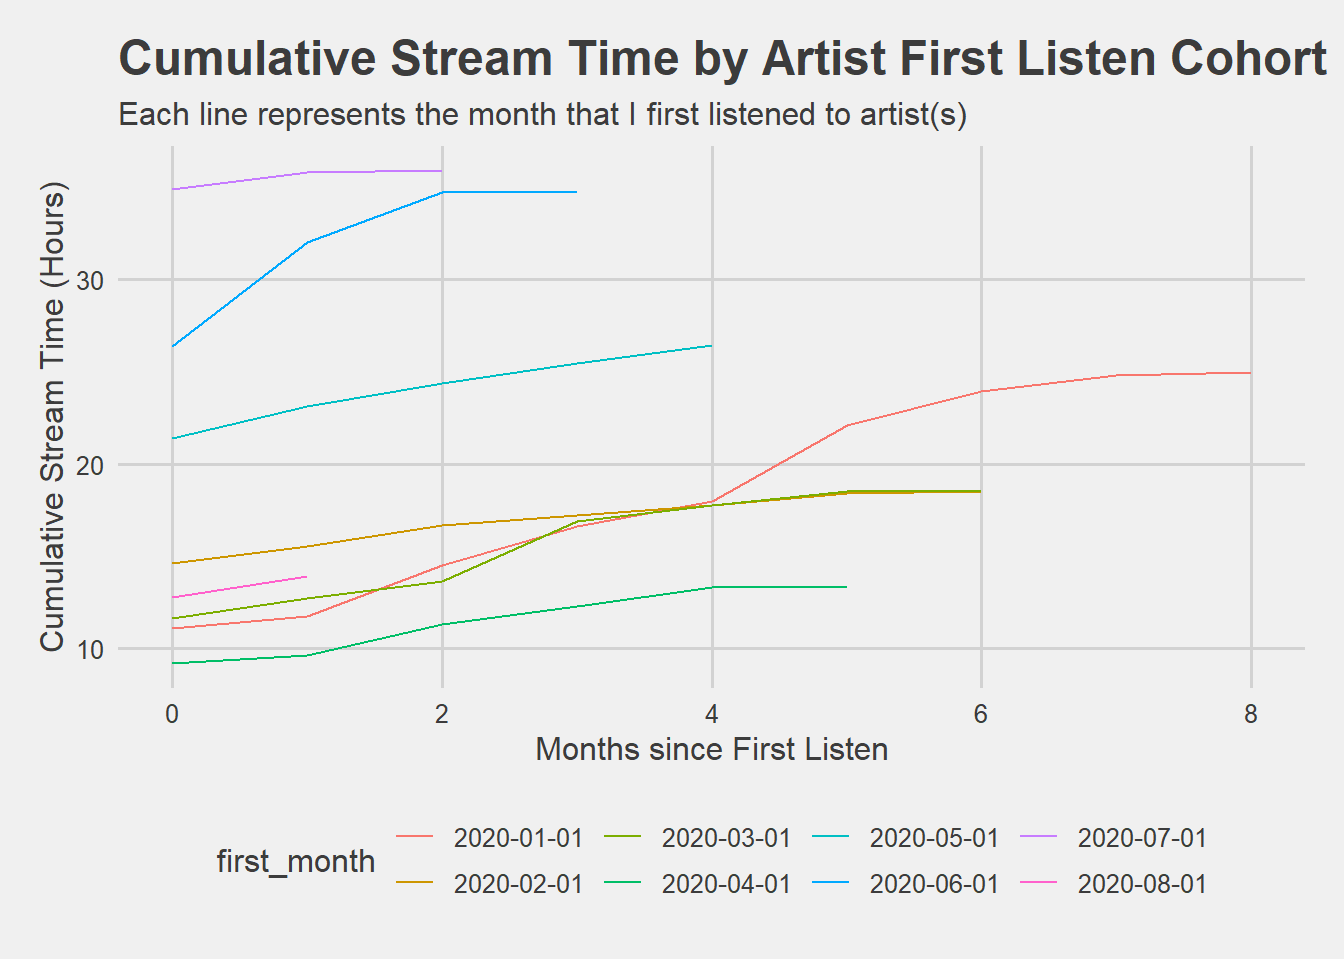
The main takeaways here are that I’ve discovered and listened to newly discovered artists in recent months to a much greater extent than artists I discovered earlier in 2020. For example, the separation between June/July and most of the other cohorts indicates that I listned to 2-3x as much of the newly discovered artists in my first month than other cohorts, and in the case of the June cohort, steadily increased engagement in the following two months.
As it turns out, this was the month I discovered the Son of a Hitman podcast, which represents 8 of the 26 hours streamed in Month 0.
Retention Framework
Many companies now monitor user retention as an indicator of how much value their users are receiving. There are countless blog posts on the topic, and I’m slowly reading every one.
Some companies, particularly in the media industry, apply similar analyses to evaluate the relative performance of their content inventory. For example, Hulu might measure same-show retention to understand how many users who watched the first episode of the Hulu Original Series High Fidelity returned to watch the next episode, or even the next season.
I’m curious to apply the same thinking to my Spotify usage data, in the form of Same-Artist Retention.
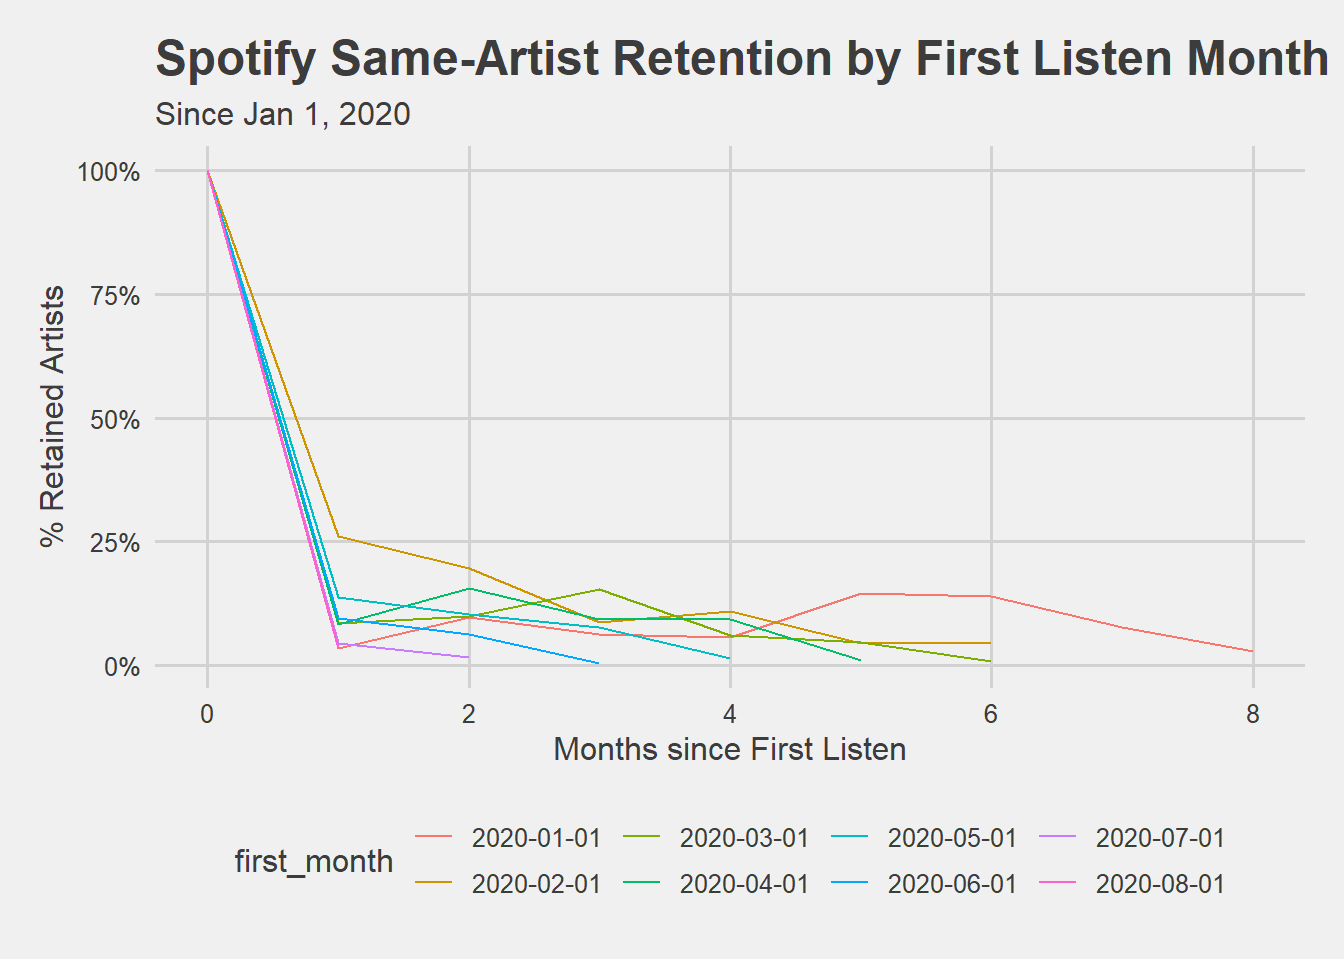
This graph shows that I tend to continue listening to 10-25% of artists beyond my first month of streaming them (and stop listening to the other 75-90%). The February 2020 cohort had the highest 1-month retention, with 25% of artists streamed in the next month, while it seems like the March and April cohorts had stronger retention rates by months 3 and 4.
This is a summary of Month 3 same-artist retention by first-month cohort:
| First Listen Month | Artists Streamed | Total Artists in Cohort | M3 Retention |
|---|---|---|---|
| 2020-01-01 | 9 | 144 | 6.25% |
| 2020-02-01 | 4 | 46 | 8.70% |
| 2020-03-01 | 20 | 131 | 15.27% |
| 2020-04-01 | 9 | 97 | 9.28% |
| 2020-05-01 | 11 | 145 | 7.59% |
| 2020-06-01 | 1 | 286 | 0.35% |
Making the Analytics Worth It…
… for Spotify
These kind of analyses often reveal amusing tidbits, but are most powerful when they improve decision-making.
One of the strategies that Spotify uses to improve retention is to deliver fresh content (i.e., notifying users about for newly released music, automatically curated playlists, etc.)
To optimize engagement, which in Spotify’s case means increasing amount of streaming time per session, they need to get users to listen to more, or longer tracks. I don’t know the ins-and-outs of today’s music industry, but I imagine Spotify pays a fortune in licensing and royalties to artists and record labels. The amount of royalty fees incurred has even caused some of Spotify’s competitors to shut down.
With both of these things in mind, it makes a lot of sense why Spotify has made several enormous acquisitions in the Podcasting space. By nature, fans of Podcasts will be retained each time they want to listen to a newly released episode. Podcasts are also much longer in duration than music tracks.
… for Me
Before looking at this data, I had no doubt that I’m getting my money’s worth from my Spotify subscription. I also can’t think of any majorly inefficient aspects of my Spotify experience to improve using his data. Most of the actual decisions when using Spotify (i.e., what to listen to) are already fairly automated within the platform. In the future, it might be interesting to integrate information from my saved playlists, and use the engagement data to improve them.