What's the plural of eephus?
I downloaded a fairly large amount of pitch data from the MLB Statcast database: every pitch thrown during the 2017 season, with ~75 variables about each.
What’s the plural of Eephus?
For the uninitiated, the Eephus pitch is a very, very slow baseball pitch. I’d hoped that the plural of eephus would be eephucies (like matrices), but it turns out isn’t a real word at all. As far as I can tell from the Google Ngram viewer, it was first used in a baseball context around 1960. More on eephuses/eephucies later.
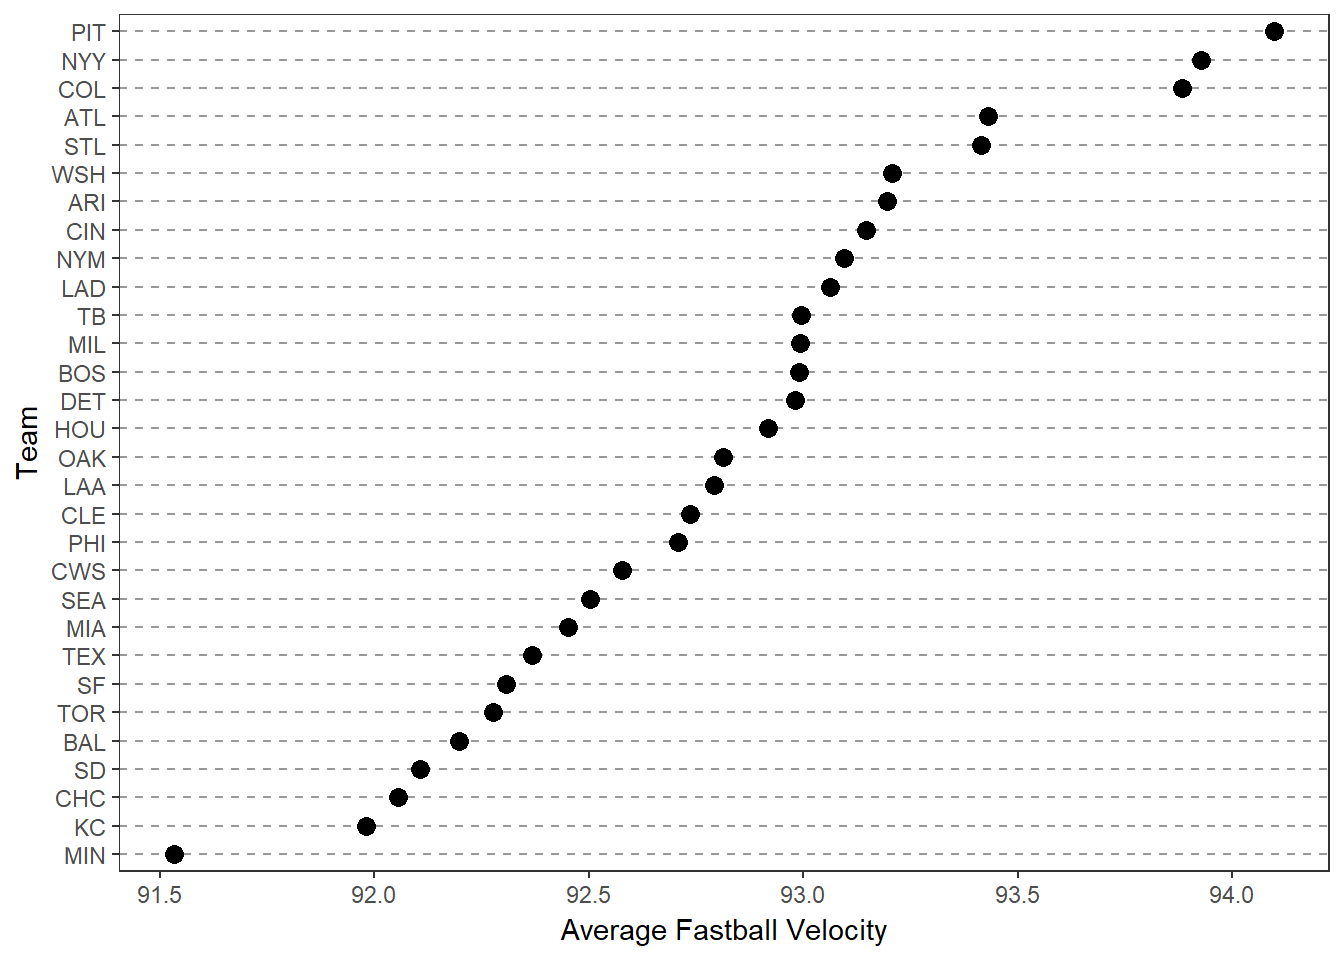
Which teams threw the hardest on average?
Eight of the top ten hardest throwing teams are in the National League, but since these rankings are likely buoyed by the relative velocity of fastballs thrown, I wanted to re-run the list by fastballs alone.
Which teams threw the fastest fastballs? (Part 1)
Since there was a bit of variance between the overall velocity and fastball velocity rankings, I wanted to get a sense of the MLB-wide velocity by pitch type. I didn’t remove the Null or unknown pitch types from the dataset, but I am curious as to how AJ Ramos chucked 11 nulls during the 2017 season.
Average velocity by pitch type
Back to fastball velocity, I created a Cleveland plot to visualize the aggregated averages of Four-Seam Fastball, Two-Seam Fastball, and Sinker, by team.
Which teams threw the fastest fastballs? (Part 2)
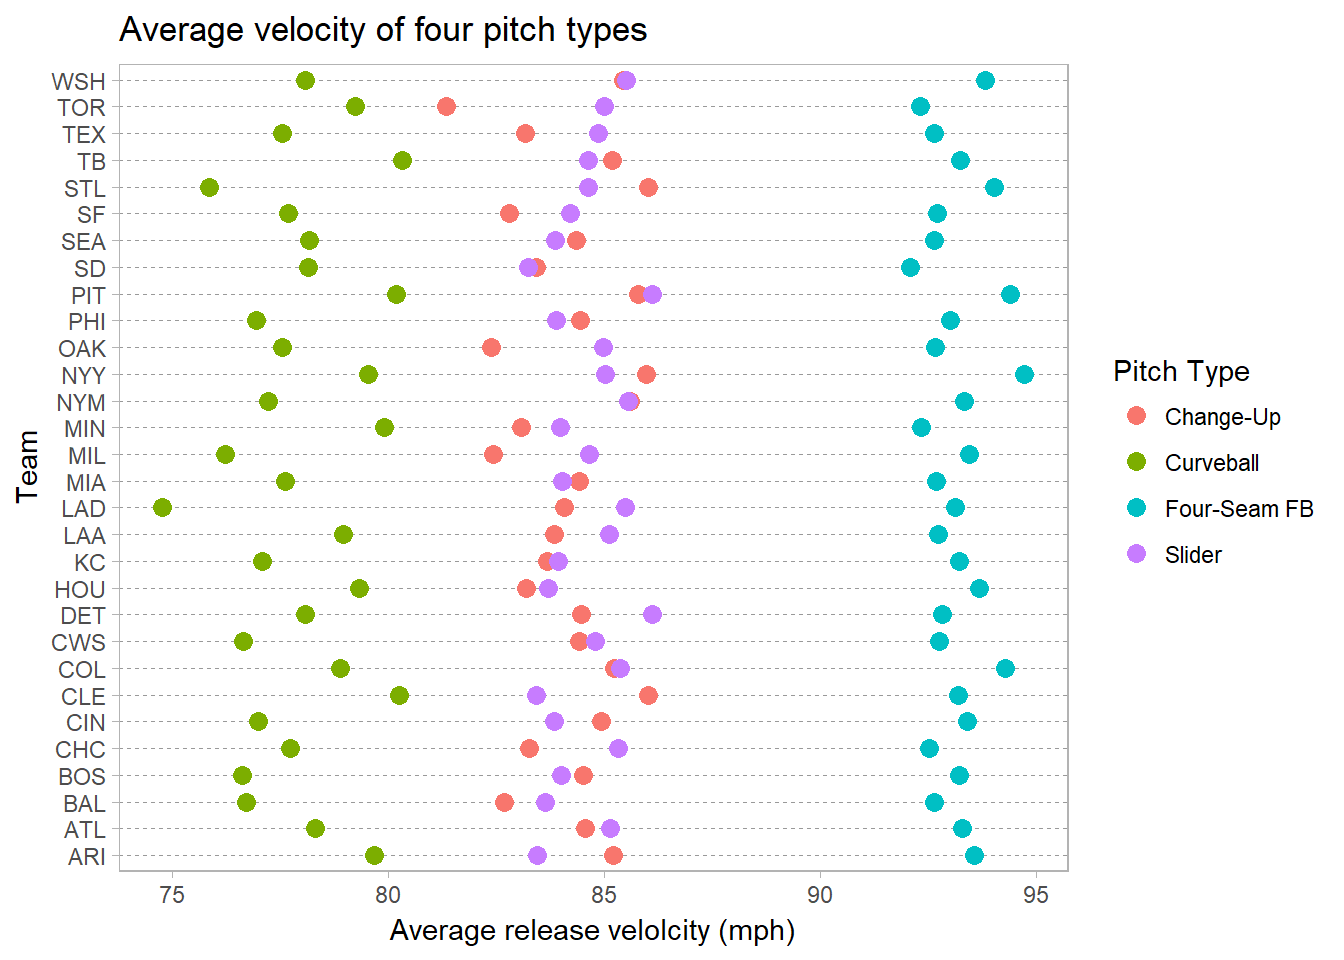
Pitch velocity by team (by common pitch type)
Since the cleveland plot is a nice way to compare pitch velocity by team, I added a couple of additional common pitch types:
- Four-Seam Fastball
- Slider
- Change-up
- Curveball
Before turning my attention back to eephuses, I wondered how fastball velocities varied by inning.
Fastball velocity by Inning
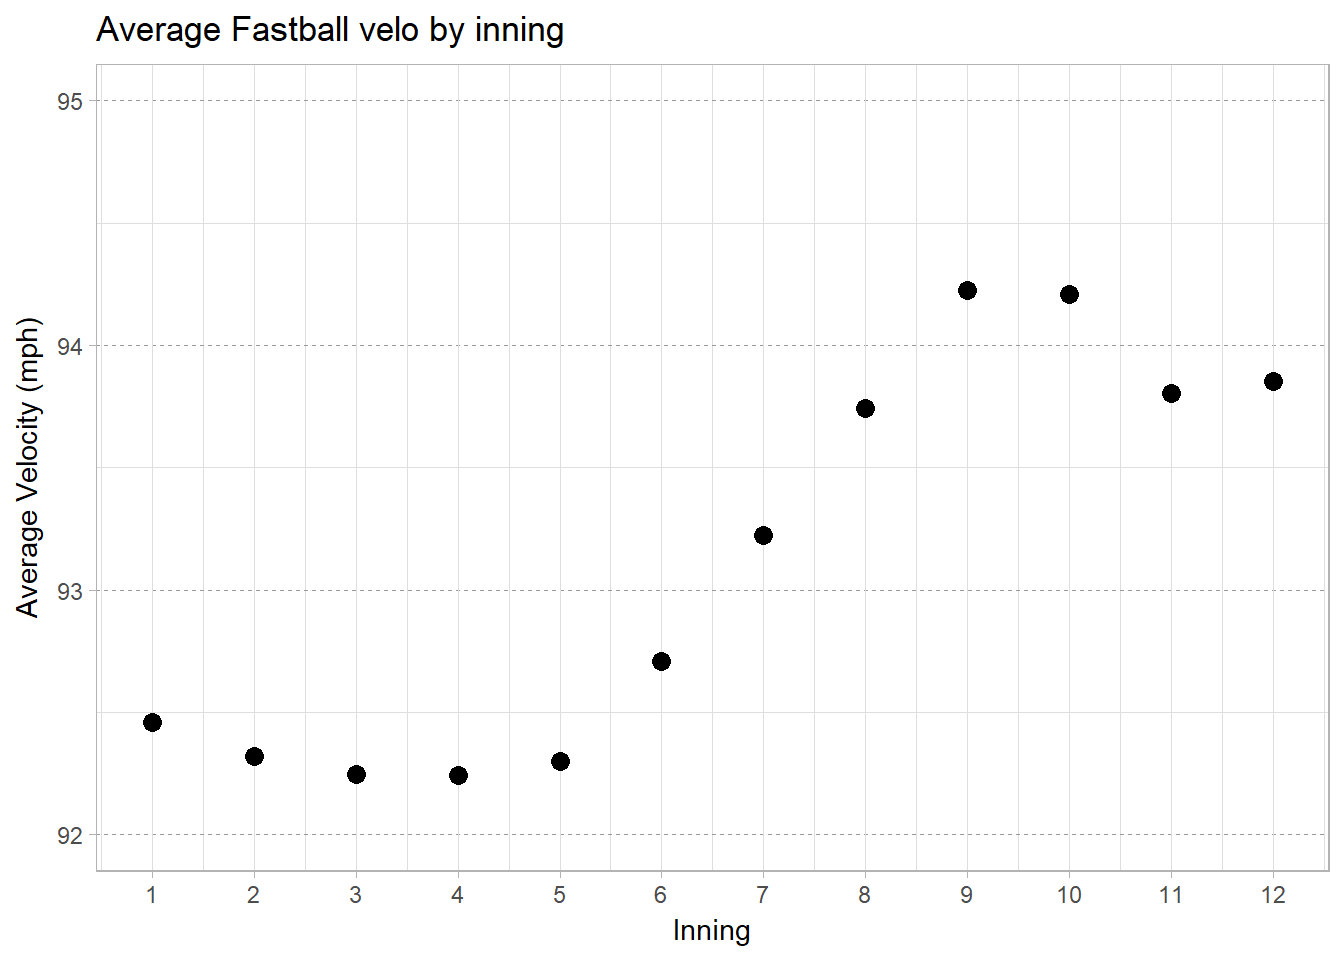
Looks like the starting pitcher’s velocity tends to fall off as they pitch deeper into a game. As relief pitchers enter the game, the average fastball velocities shoot up. Just a hunch: the velocities between the 5th and 8th innings are equally affected by each game’s innings pitched by starting pitchers and the timing of the typically hard-throwing relief pitchers entering the game. In other words, I’d predict that the average starting pitcher’s IP is around 5 innings, which is when the average fastball velocity starts to increase.
Eephuses/Eephucies
There were 147 eephuses thrown during the 2017 regular season.
Who threw them?
RA Dickey makes sense, being a knuckleballer, but I was surprised by James Shields. The Chicago Sun-Times wrote about Shields’ curveball registering as an eephus early in the season, so these pitches may have been miscoded by Statcast.
Were they balls, strikes, or put in-play?
The x denotes an eephus put in play by the batter… 16%` of eephuses were batted into play.
What were the outcomes of eephuses put in-play?
Shout-out to Jose Peraza for hitting the 2017 season’s only HR off of an Eephus.