Three-pointers after offensive rebounds
During the Duke-Kentucky college basketball season opener, after one of twelve of Duke’s made three-point shots, Jay Bilas claimed that “the best time to shoot a three is following an offensive rebound.” I’ve heard other commentators say this before, and wondered if it’s actually true. This post walks through my investigation of that claim using play-by-play data from the 2017-18 men’s college basketball season.
Preparing the data
My play-by-play dataset includes 2.7 million rows - one for every tracked play during the 2017-18 NCAA D-I Men’s Basketball season. Some of the plays encompass multiple statistical events. For example, a made three-pointer counts as a field goal attempted, field goal made, three-point fg attempted, and three-point fg made. The dataset contains a Tags field, which includes each of the one or more events that are tracked by a single play.
Filtering the Relevant Plays
Since this analysis is only concerned with three-point field goals, the main data wrangling task is to identify specific play-by-play record pairs: plays containing offensive rebounds, which are immediately followed by plays containing a three-point fg attempt.
Now that the potentially relevant rows are tagged, the last step is to differentiate regular old three-point attempts from those that were preceded by an offensive rebound. I do this by checking each 3PA for the following: 1) whether the previous play was an Offensive Rebound (isORB). 2) whether the two events are in the same game (using matching TeamIDs as proxy) 3) whether the two events occurred in the same period (i.e., no offensive rebounds to end the first half, and 3pt attempt to start the second half.)
The dplyr package’s lag function makes running these tests incredibly easy.
Visualizing the Data
After cleaning the play-by-play data, I created a series of plots to see if there were any obvious patterns, or additional factors that I hadn’t yet considered.
Overall Three Point Shooting Percentage
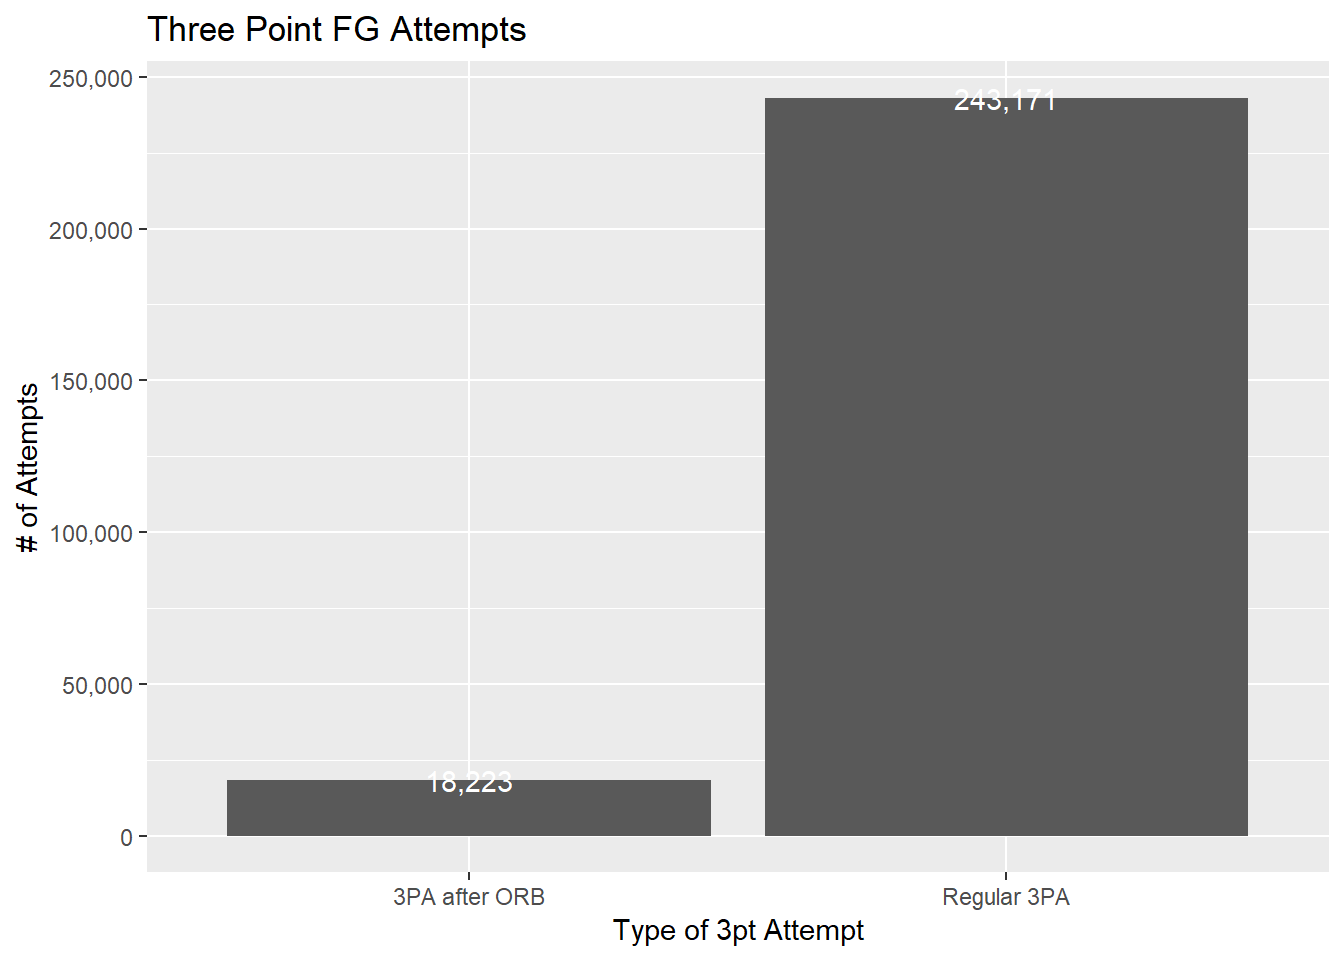
The plot below shows the total number of three point shots attempted, segmented by those that followed an offensive rebound and those that did not. There were 13x as many regular three point attempts, than attempts that followed offensive rebounds.
This plot shows the same as above, but based on three point field goal percentage (i.e., the % of made three point field goals) rather than three point field goals attemped. So far, Jay Bilas’ claim looks good - the 3pt FG Pct for shots after offensive rebounds was about 1.5% higher.

Team-level Summary
The next plot shows each team’s 2017-18 Three Point FG Pct for both types of shots. This was meant to show whether most teams make more post-ORB threes (green dots) than regular threes (red dots). Since it includes all 351 D-I teams, it is extremely long.
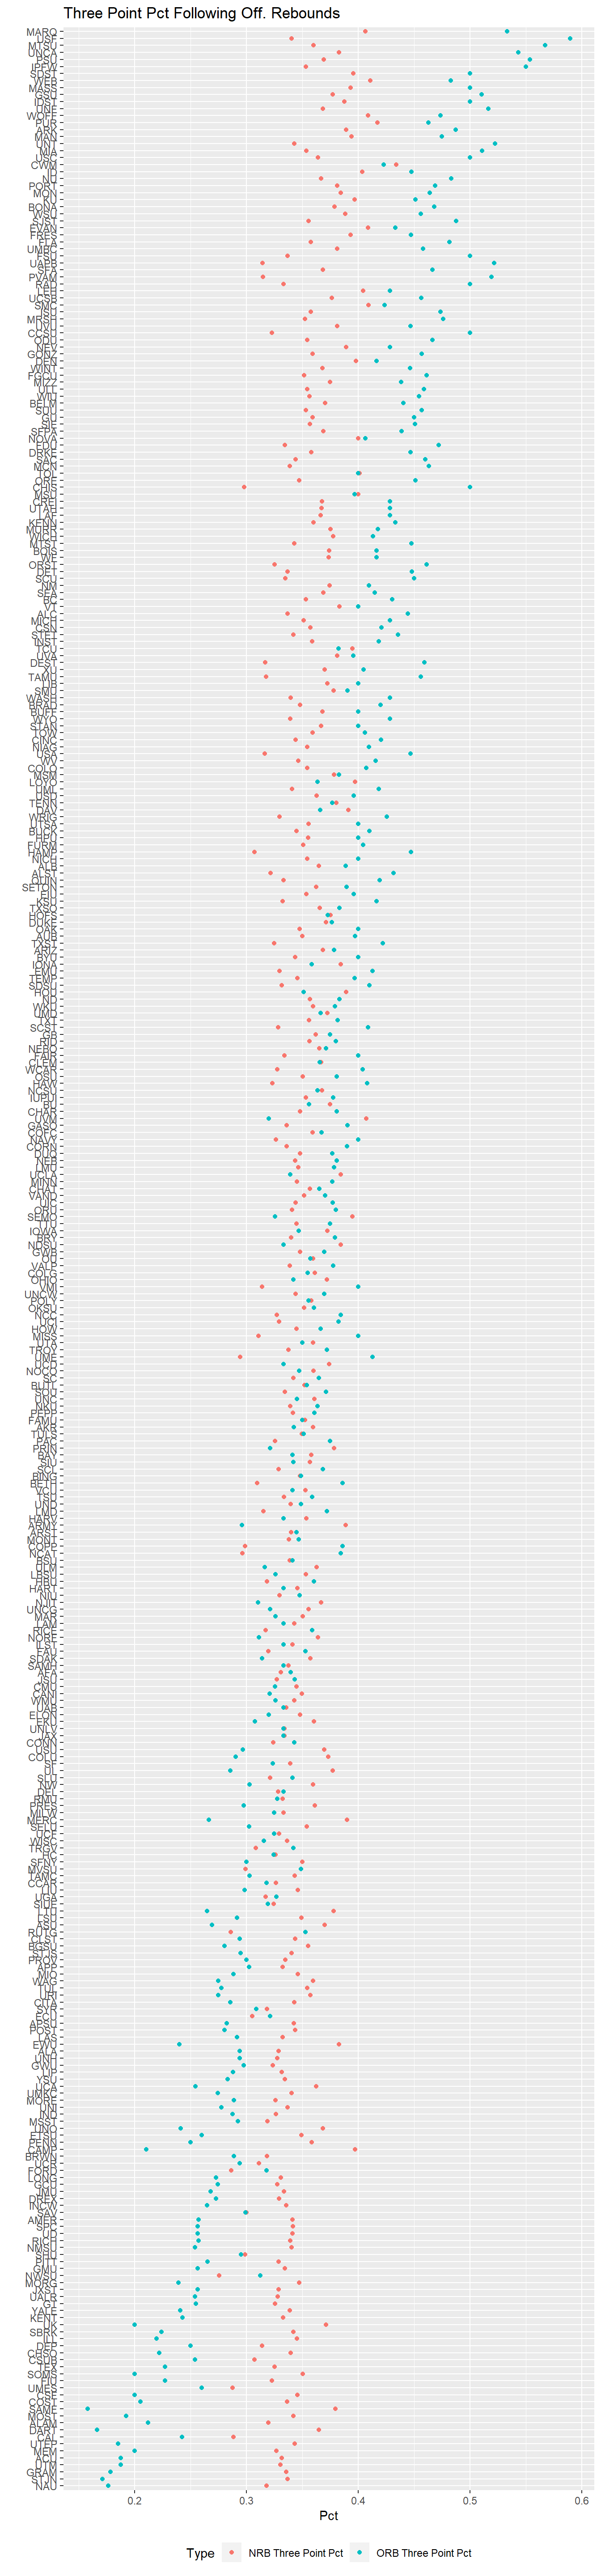
While it looks like many teams make more of their 3pt shots when following an offensive rebound, there is quite a bit of variance. Interestingly, some teams shot far worse following offesnive rebounds. Samford made only 14% of their 3pt attempts following offesnive rebounds, compared to a very good 38% 3pt percentage otherwise.
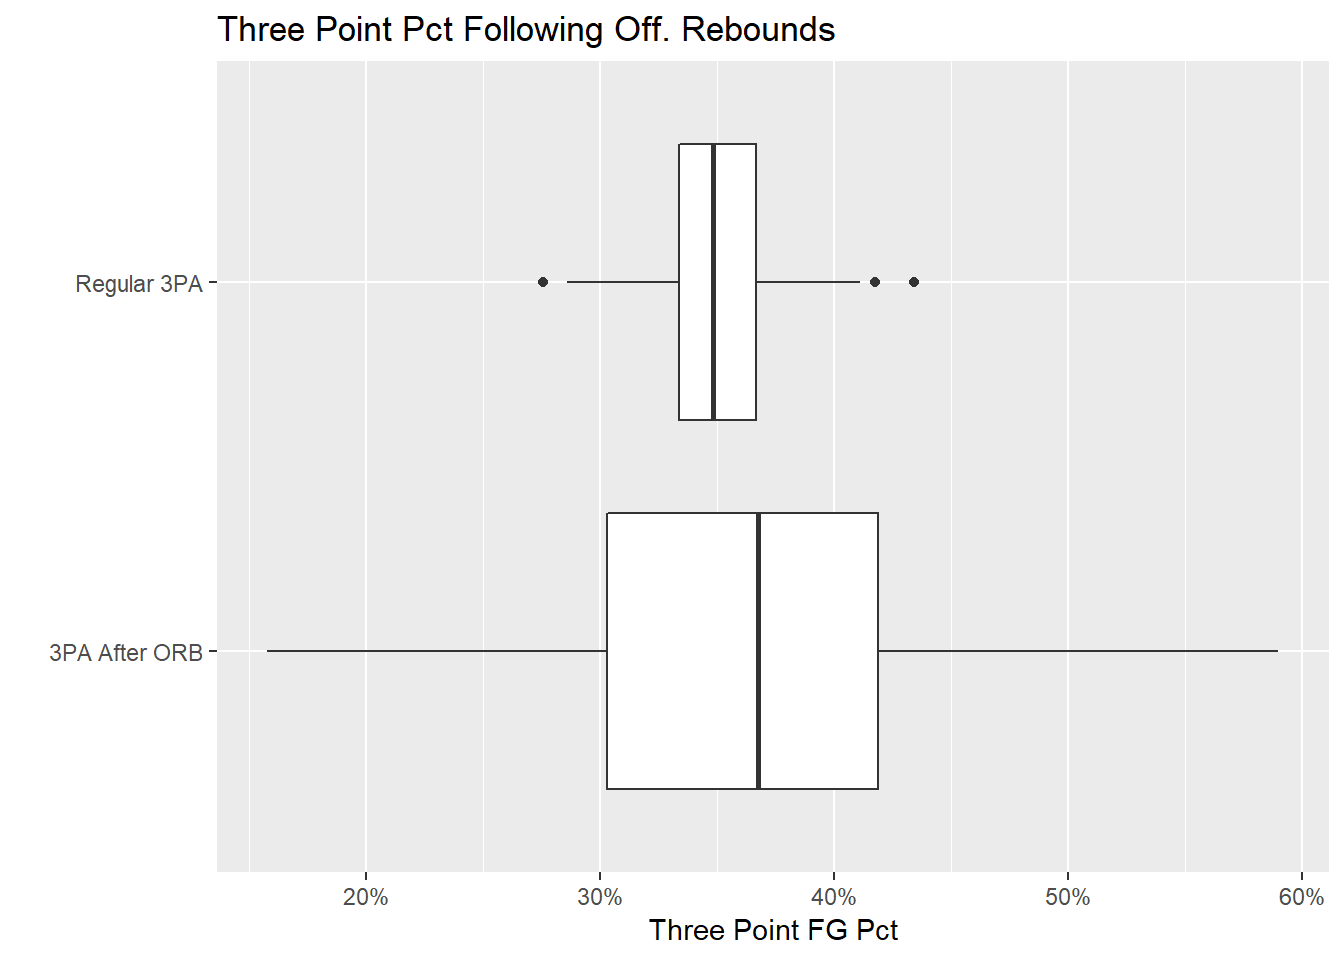
Another way to illustrate this variance is with a box-and-whisker plot. The top graph shows that most teams make non-offensive rebounding three point shots between 32-37% of the time, while the bottom graph shows that a the 50th percentile team shoots post-Offensive Rebound threes at about 37%. It also shows that the 25th percentile team shoots far, far poorer than the 25th percentile team for regular three point attempts.
Time Elapsed between Rebound and Shot
Another thing I thought might be important is the amount of time that elapses between the offensive rebound and the three point attempt. Jay Bilas expanded his point asserting that defenses are usually not set up to defend against long-range shots following an offensive rebound. With this in mind, I expected the data to show 3pt FG percentage decreasing as time elapses between an ORB and a 3pt FG attempt.
The histogram below shows the time elapsed between offensive rebounds and three-point attempts during the 2017-18 season.
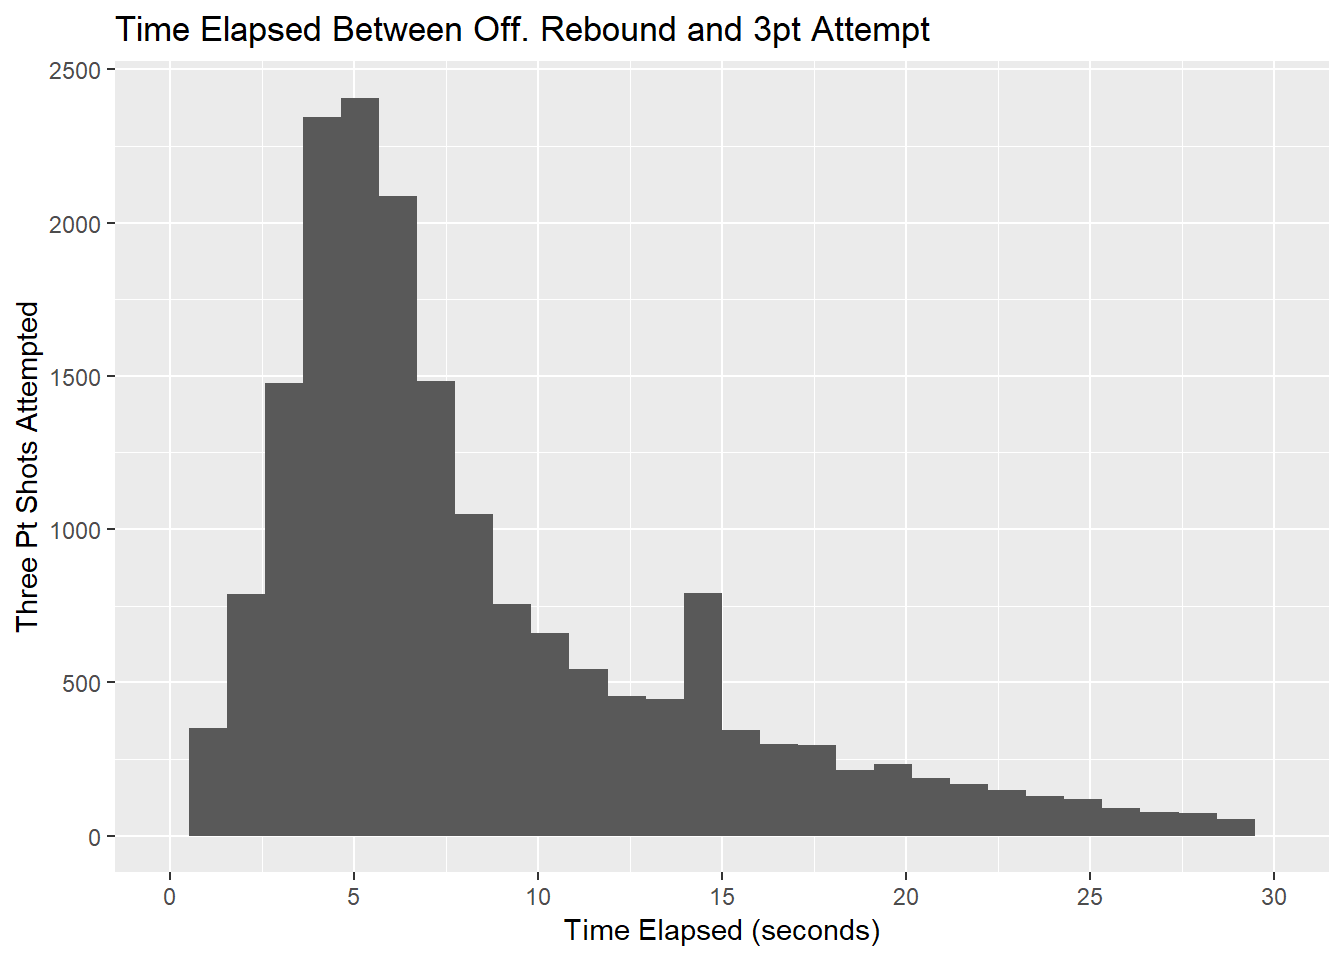
It seems that most shots happen between 3-6 seconds after the offensive rebound. The final plot below looks at the 3pt field goal percentage against time elapsed. As exepected, the shooting percentage is fairly high in the seconds immediately following a rebound, and tends to decline as time elapses after the offensive rebound.
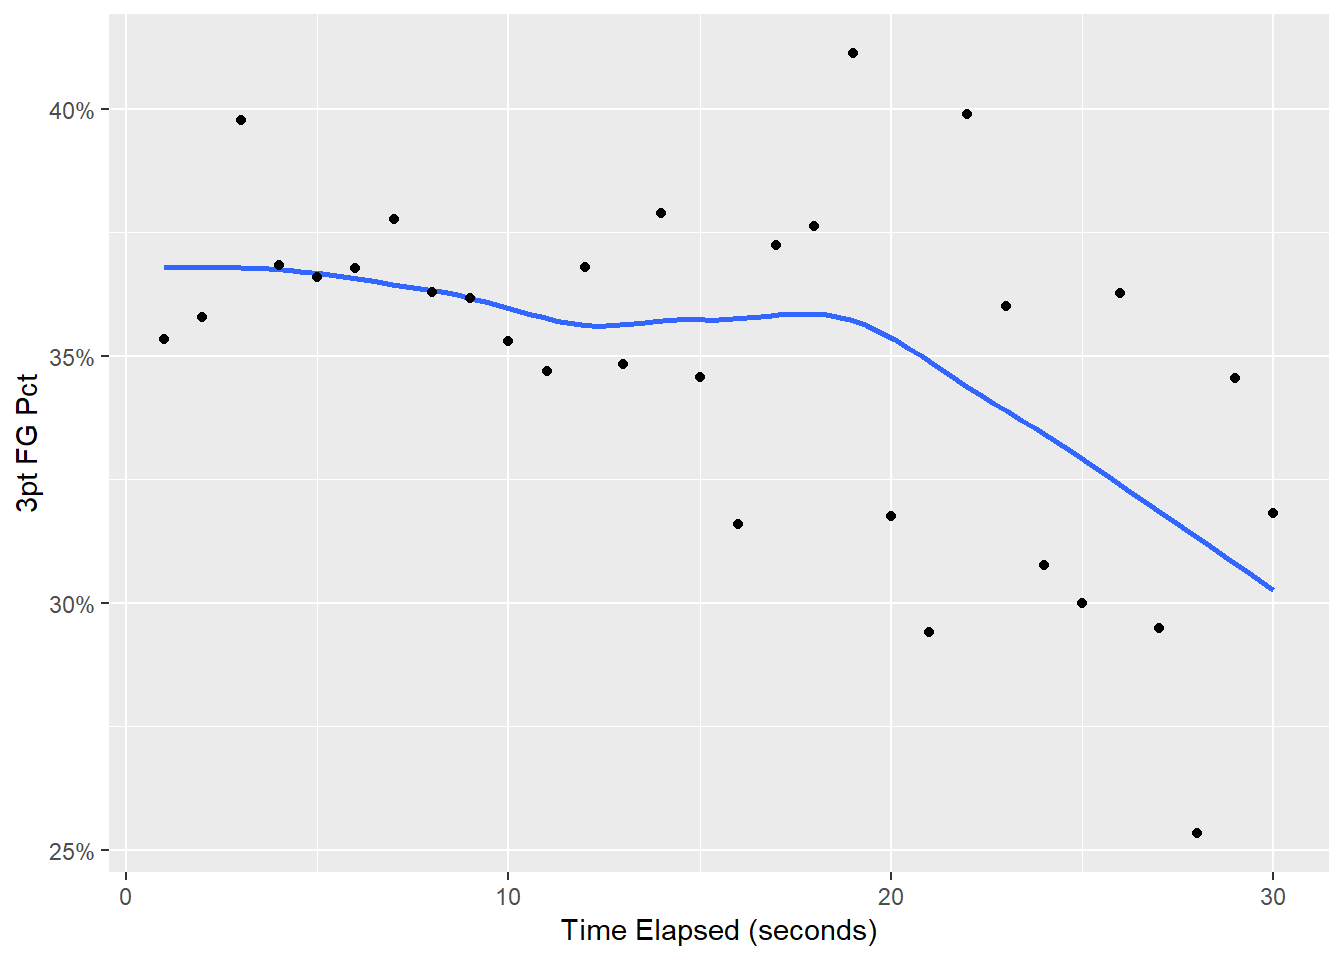
It’s hard to say definitively that the the best time to shoot a three is following an offensive rebound, but it seems safe to say that a good time to shoot a three is within the first few seconds following an offesnive rebound.
Thanks to National Statistical for their play-by-play data.